Meme Coins Price Forecast: DOGE, SHIB, PEPE flash sell signals, hint at further losses
- Dogecoin extends the 5% loss from Monday as the MACD flashes a sell signal.
- Shiba Inu risks a triangle fallout as selling pressure mounts.
- Pepe edges closer to a psychological support amid an impending Death Cross.

Meme coins, such as Dogecoin (DOGE), Shiba Inu (SHIB), and Pepe (PEPE), are experiencing a decline as selling pressure builds in the broader cryptocurrency market. A widespread increase in bearish bets, with technical outlooks indicating risks skewed lower, suggests a downside path for least resistance.
Bearish bets on the rise
CoinGlass data shows the short positions are on the rise, suggesting a sell-side dominance in the DOGE, SHIB, and PEPE derivatives market. This suggests a spreading risk-off sentiment, as the majority of traders anticipate further losses.
The Taker buy-to-sell volume indicates 55% short positions built over the last 24 hours, while optimism in SHIB is even lower, with 57% short positions.
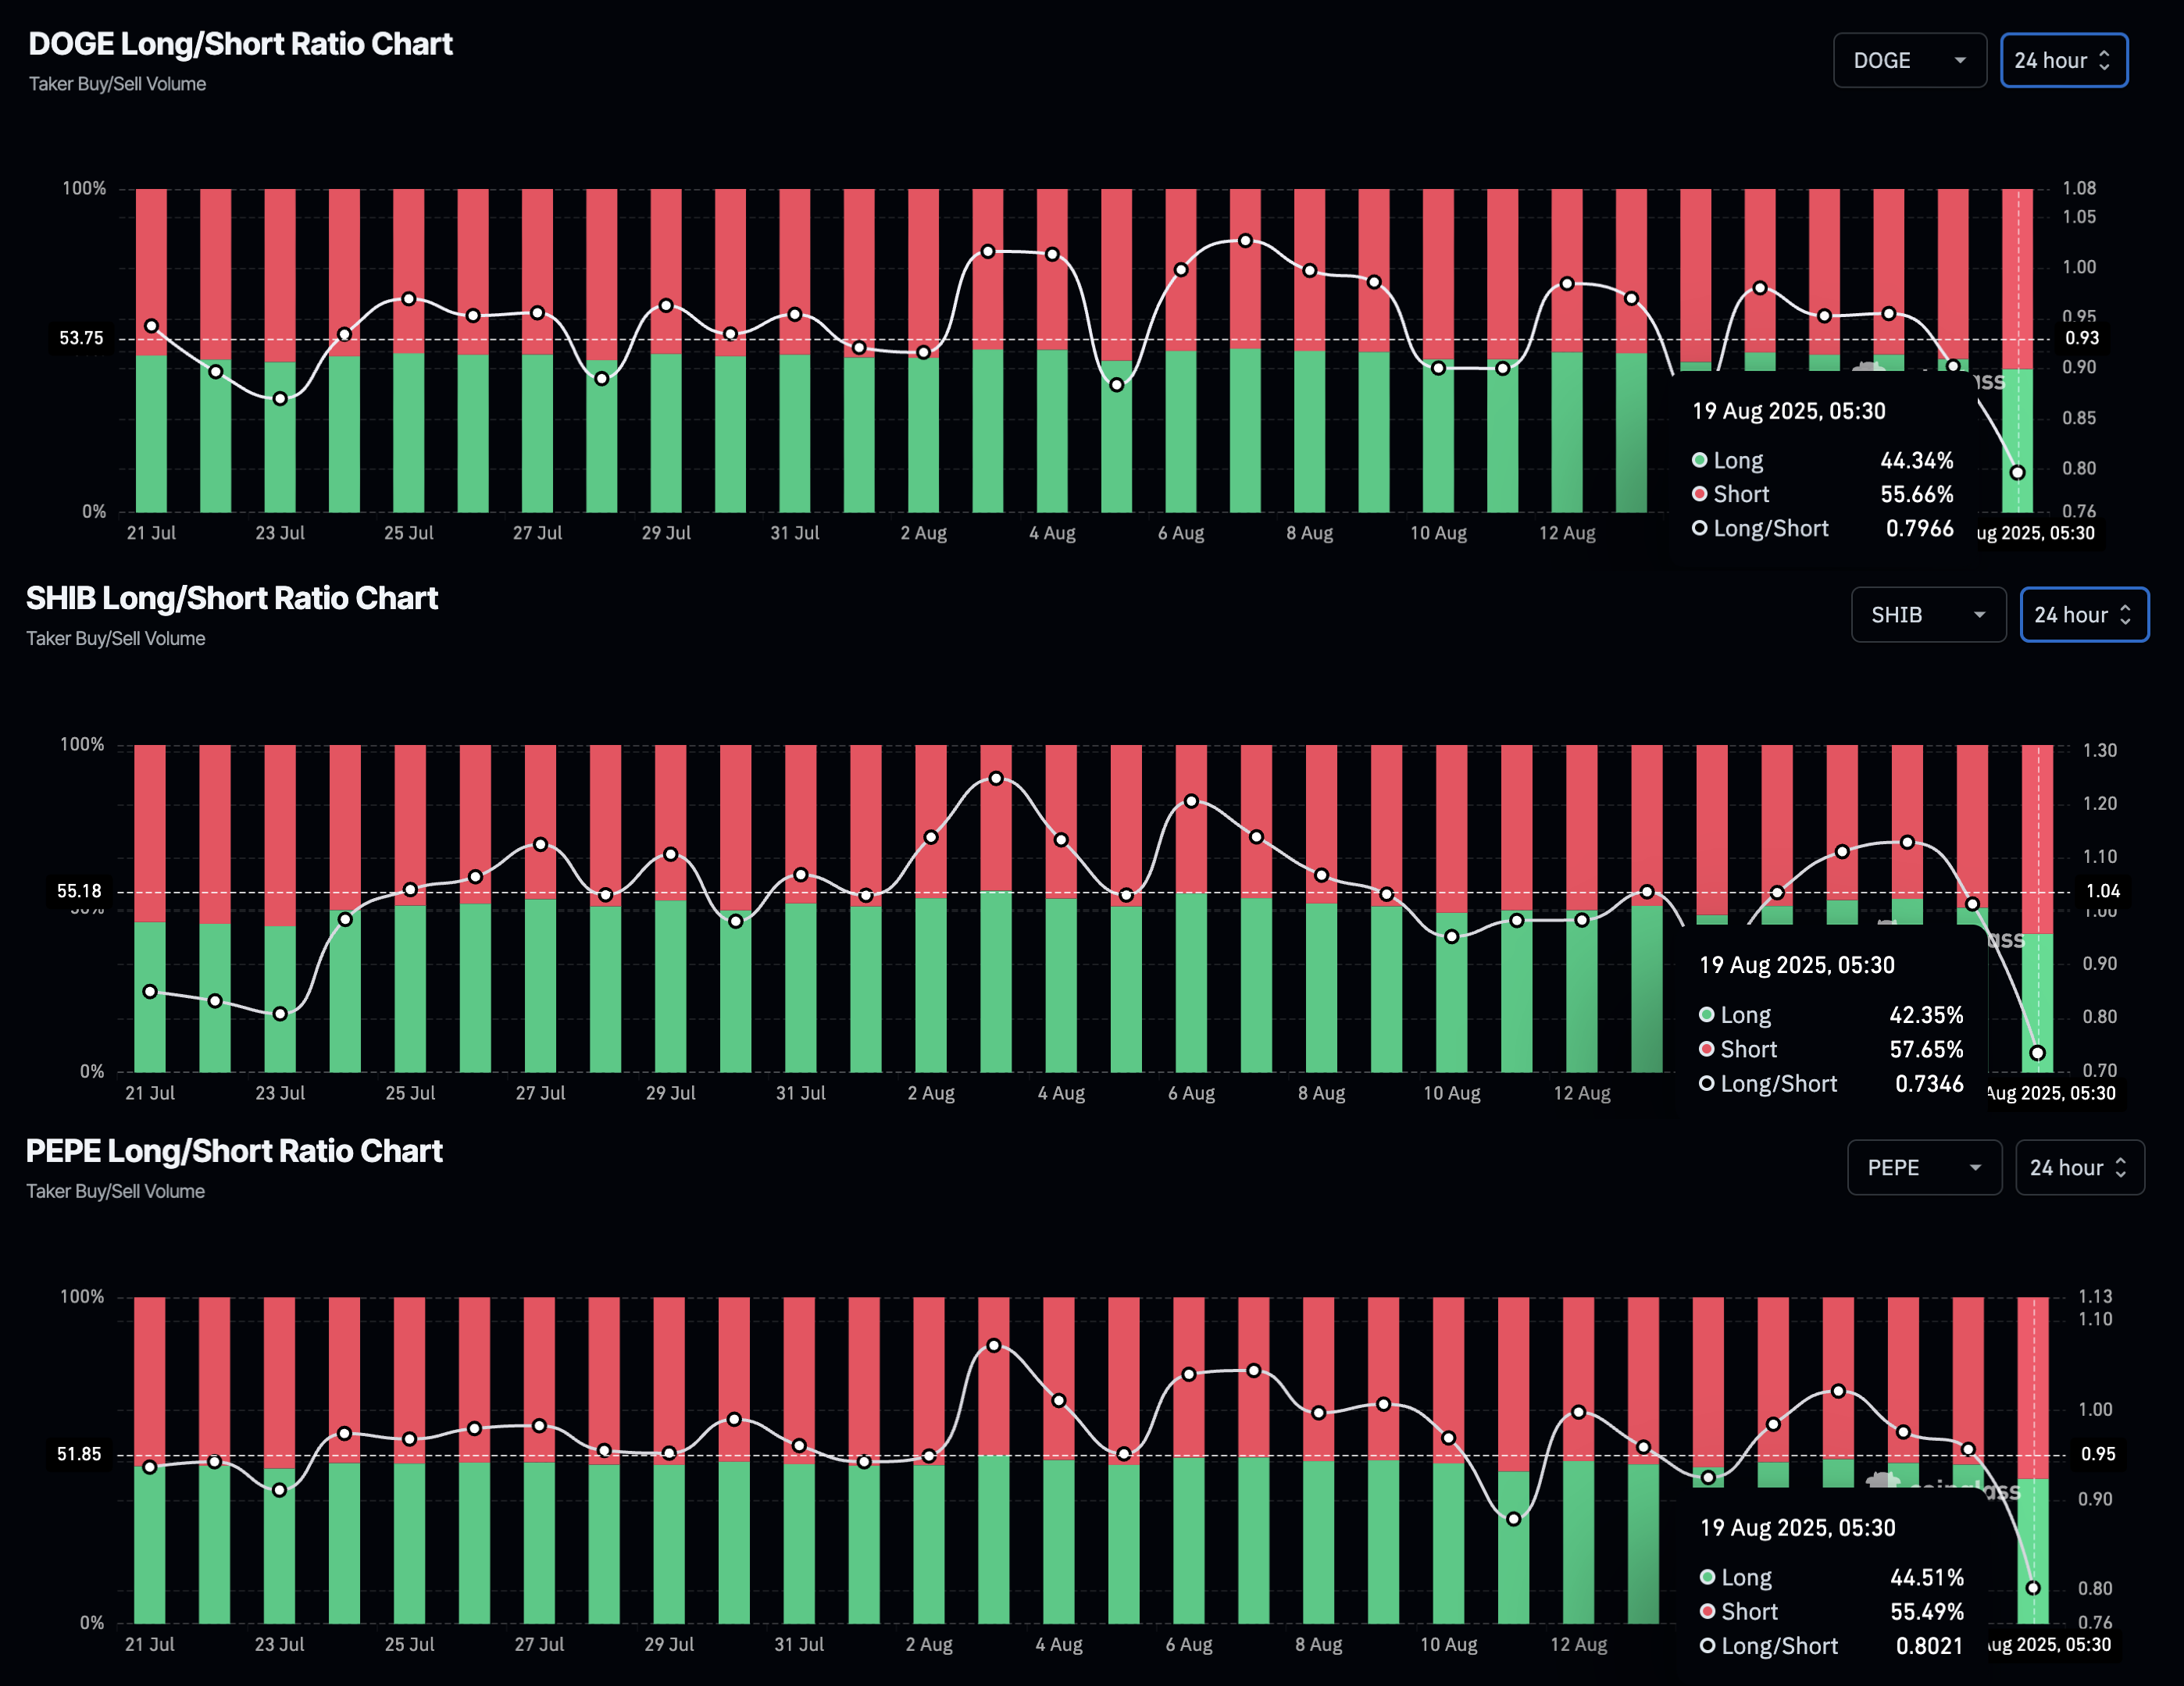
Long-to-Short ratio chart. Source: Coinglass.
Dogecoin bears eye further losses
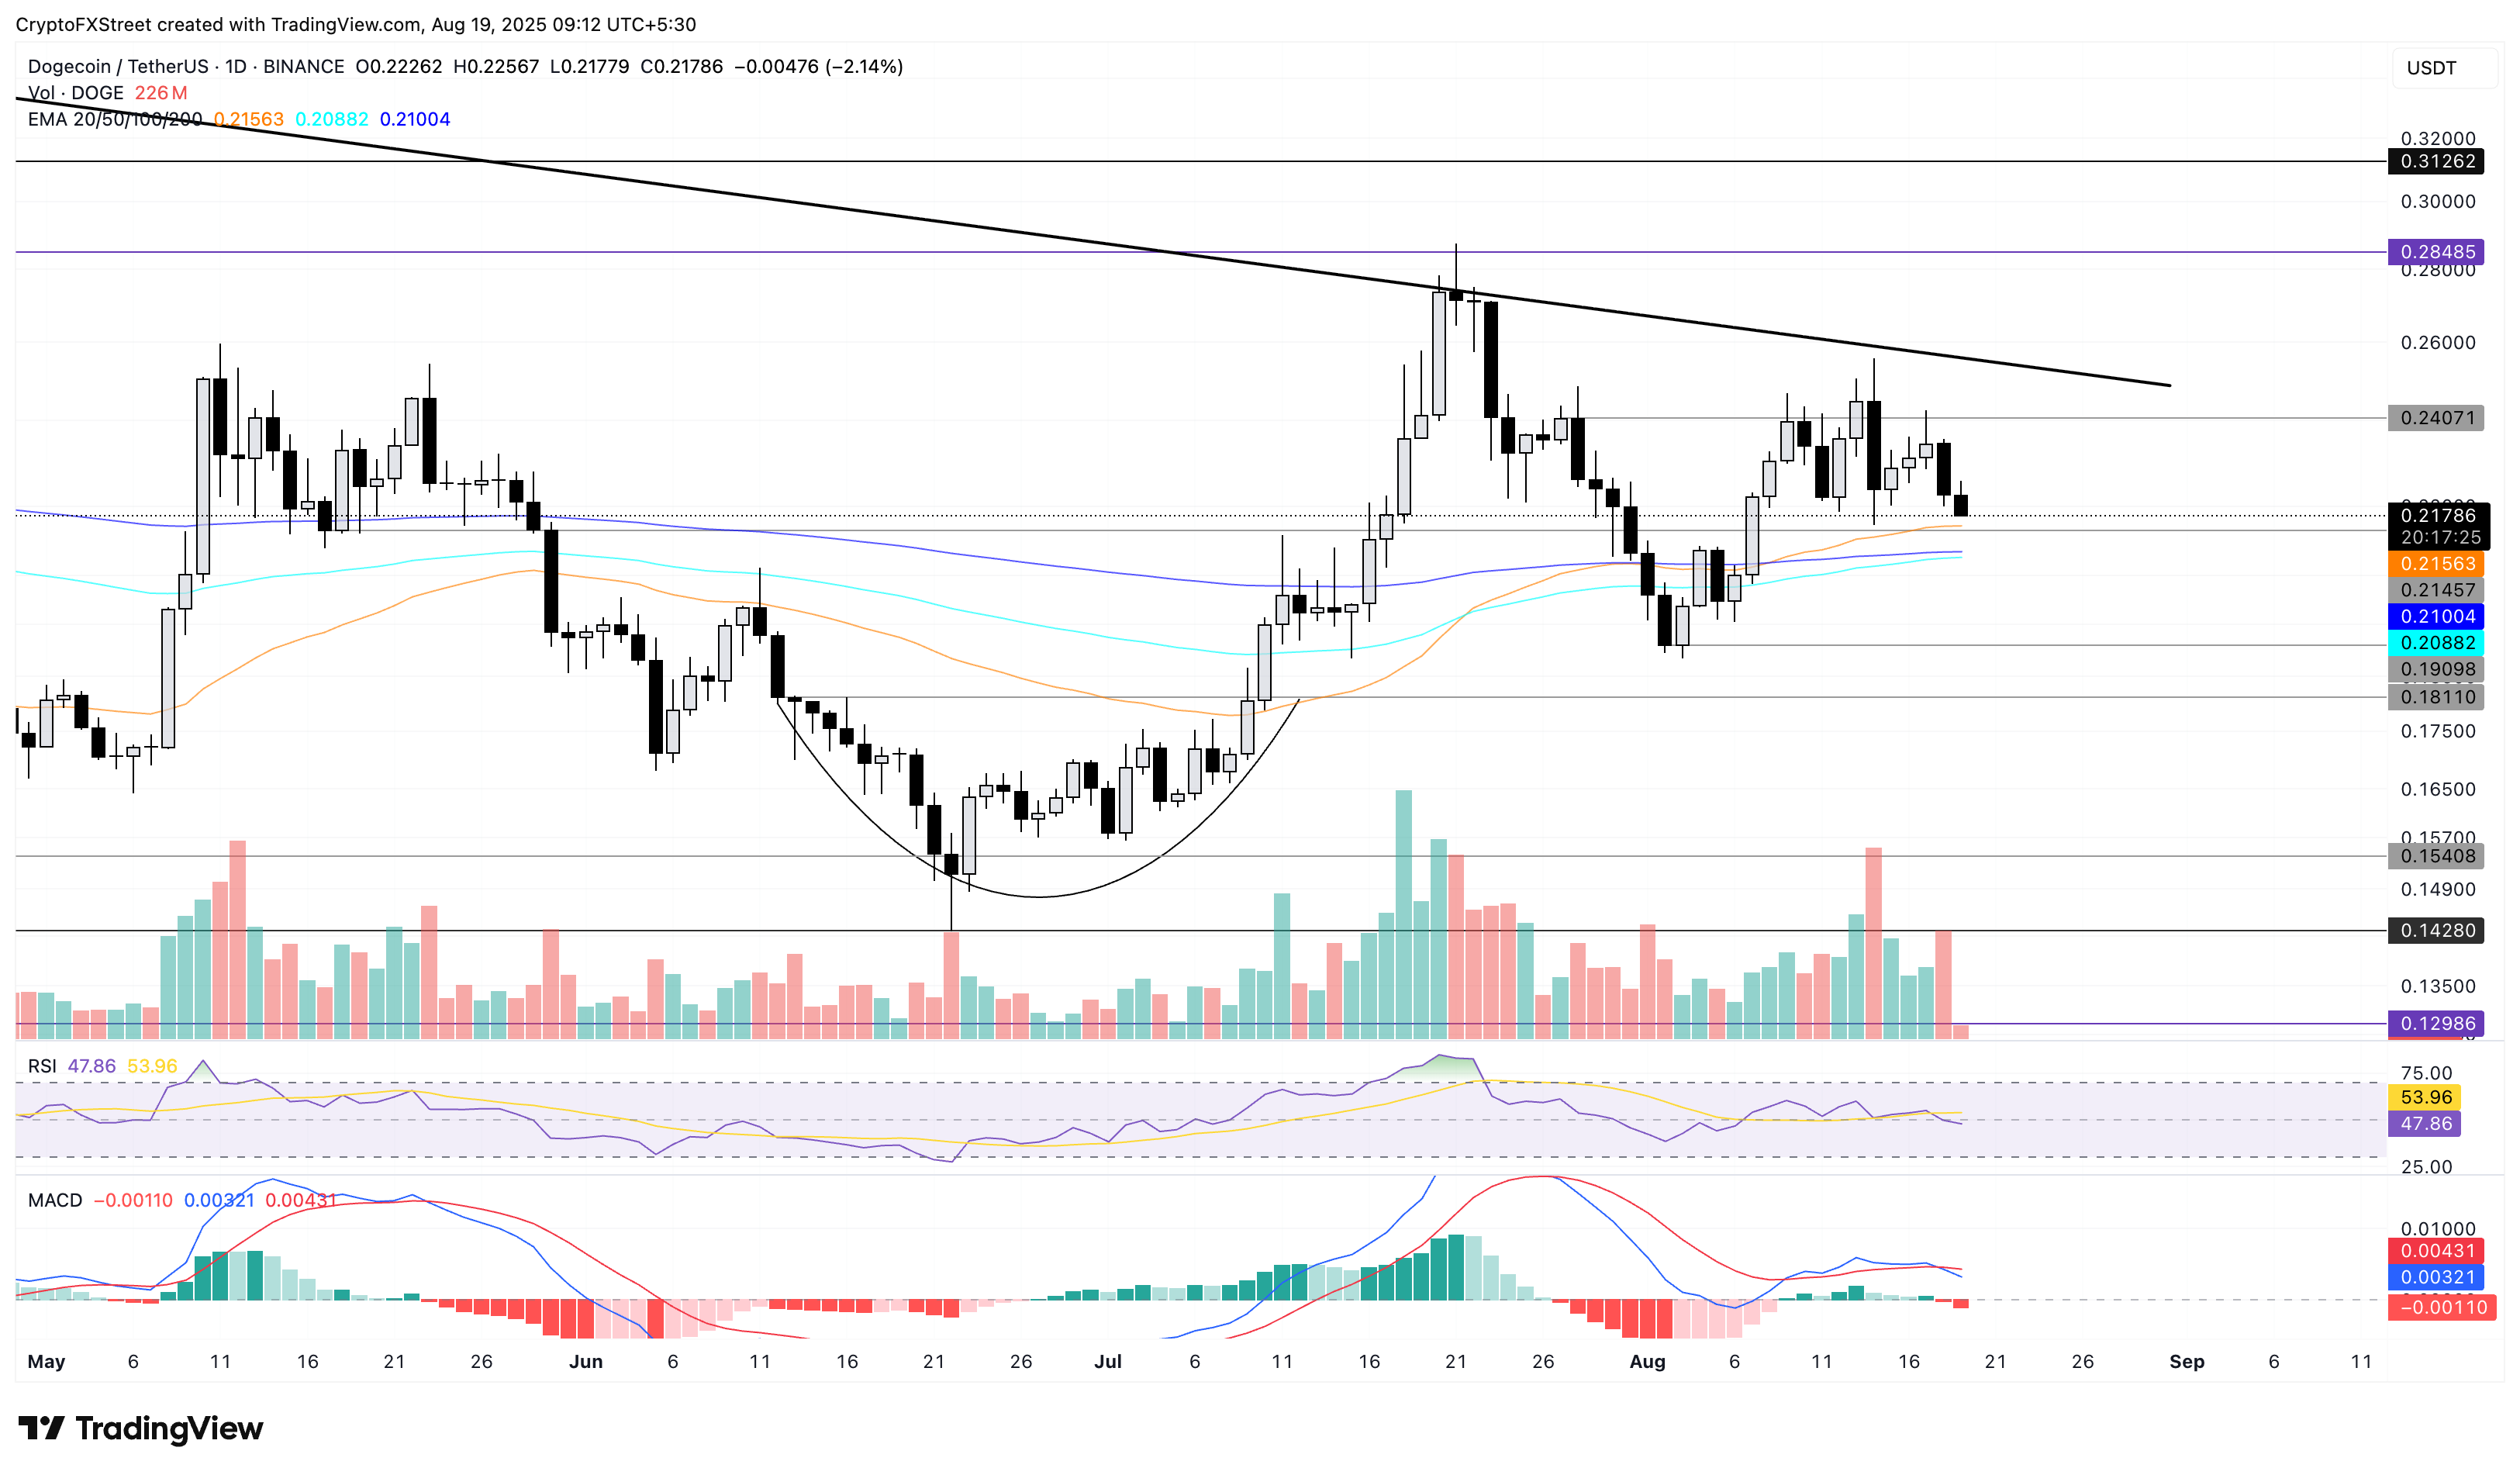
Dogecoin edges lower by 2% at press time on Tuesday, extending the 5% loss from Monday and approaching the 50-day Exponential Moving Average at $0.2163. A decisive push below the 50-day EMA could extend the decline to the 200-day EMA at $0.2100.
The Moving Average Convergence Divergence (MACD) flashed a sell signal Monday as it crossed below its signal line. Additionally, the Relative Strength Index (RSI) at 47 drops below the halfway line, indicating declining buying pressure.
DOGE/USDT daily price chart.
If Dogecoin flips from the 50-day EMA, the meme coin could retest the $0.2407 level, last tested on Sunday.
Shiba Inu risks triangle breakdown
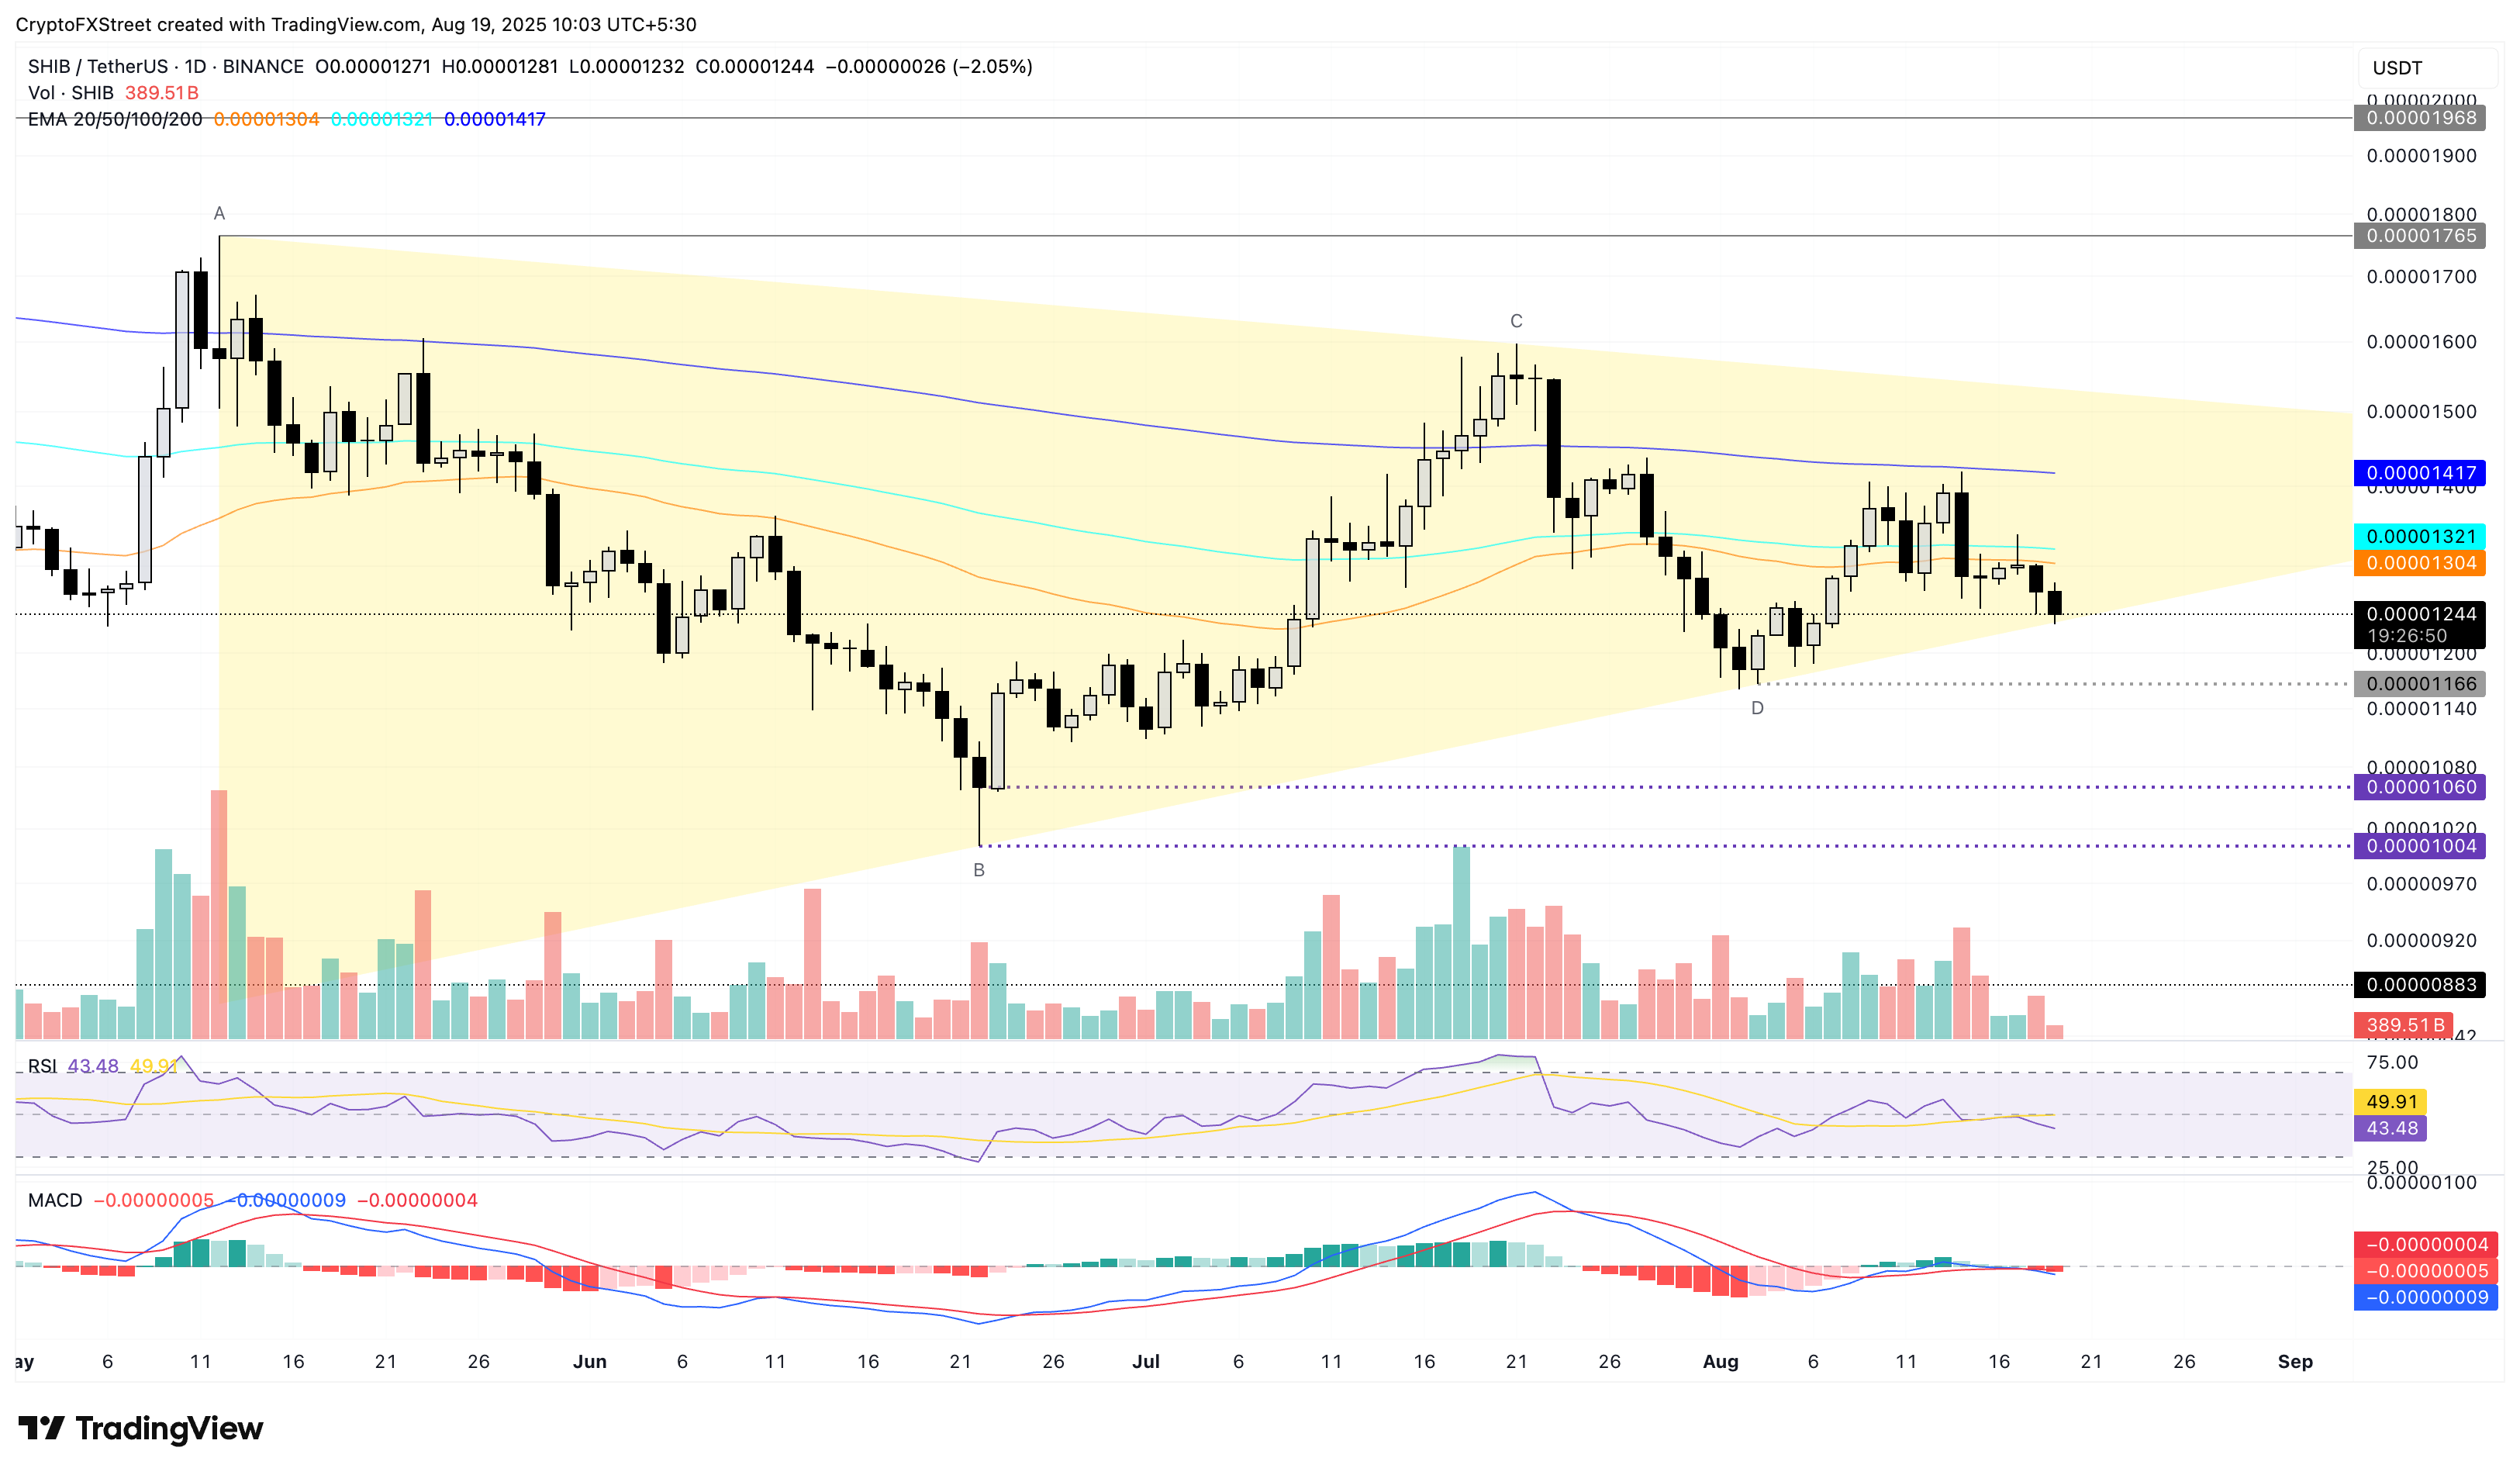
Shiba Inu failed to sustain above the 50-day EMA on Sunday, resulting in a 2.46% drop on Monday. At the time of writing, SHIB edges lower by 2% on Tuesday, risking a breakdown of a symmetrical triangle pattern on the daily chart (shared below).
A decisive close below the support trendline at $0.00001244 would invalidate the triangle pattern, potentially extending the decline to $0.00001166.
Similar to DOGE, the MACD and signal line flashed a sell signal on Monday as bearish momentum increased. Furthermore, the RSI is at 43, pointing downwards as buying pressure declines.
SHIB/USDT daily price chart.
On the contrary, a bounce back in SHIB within the triangle could retest the 50-day EMA at $0.00001304.
Pepe risks losing psychological support
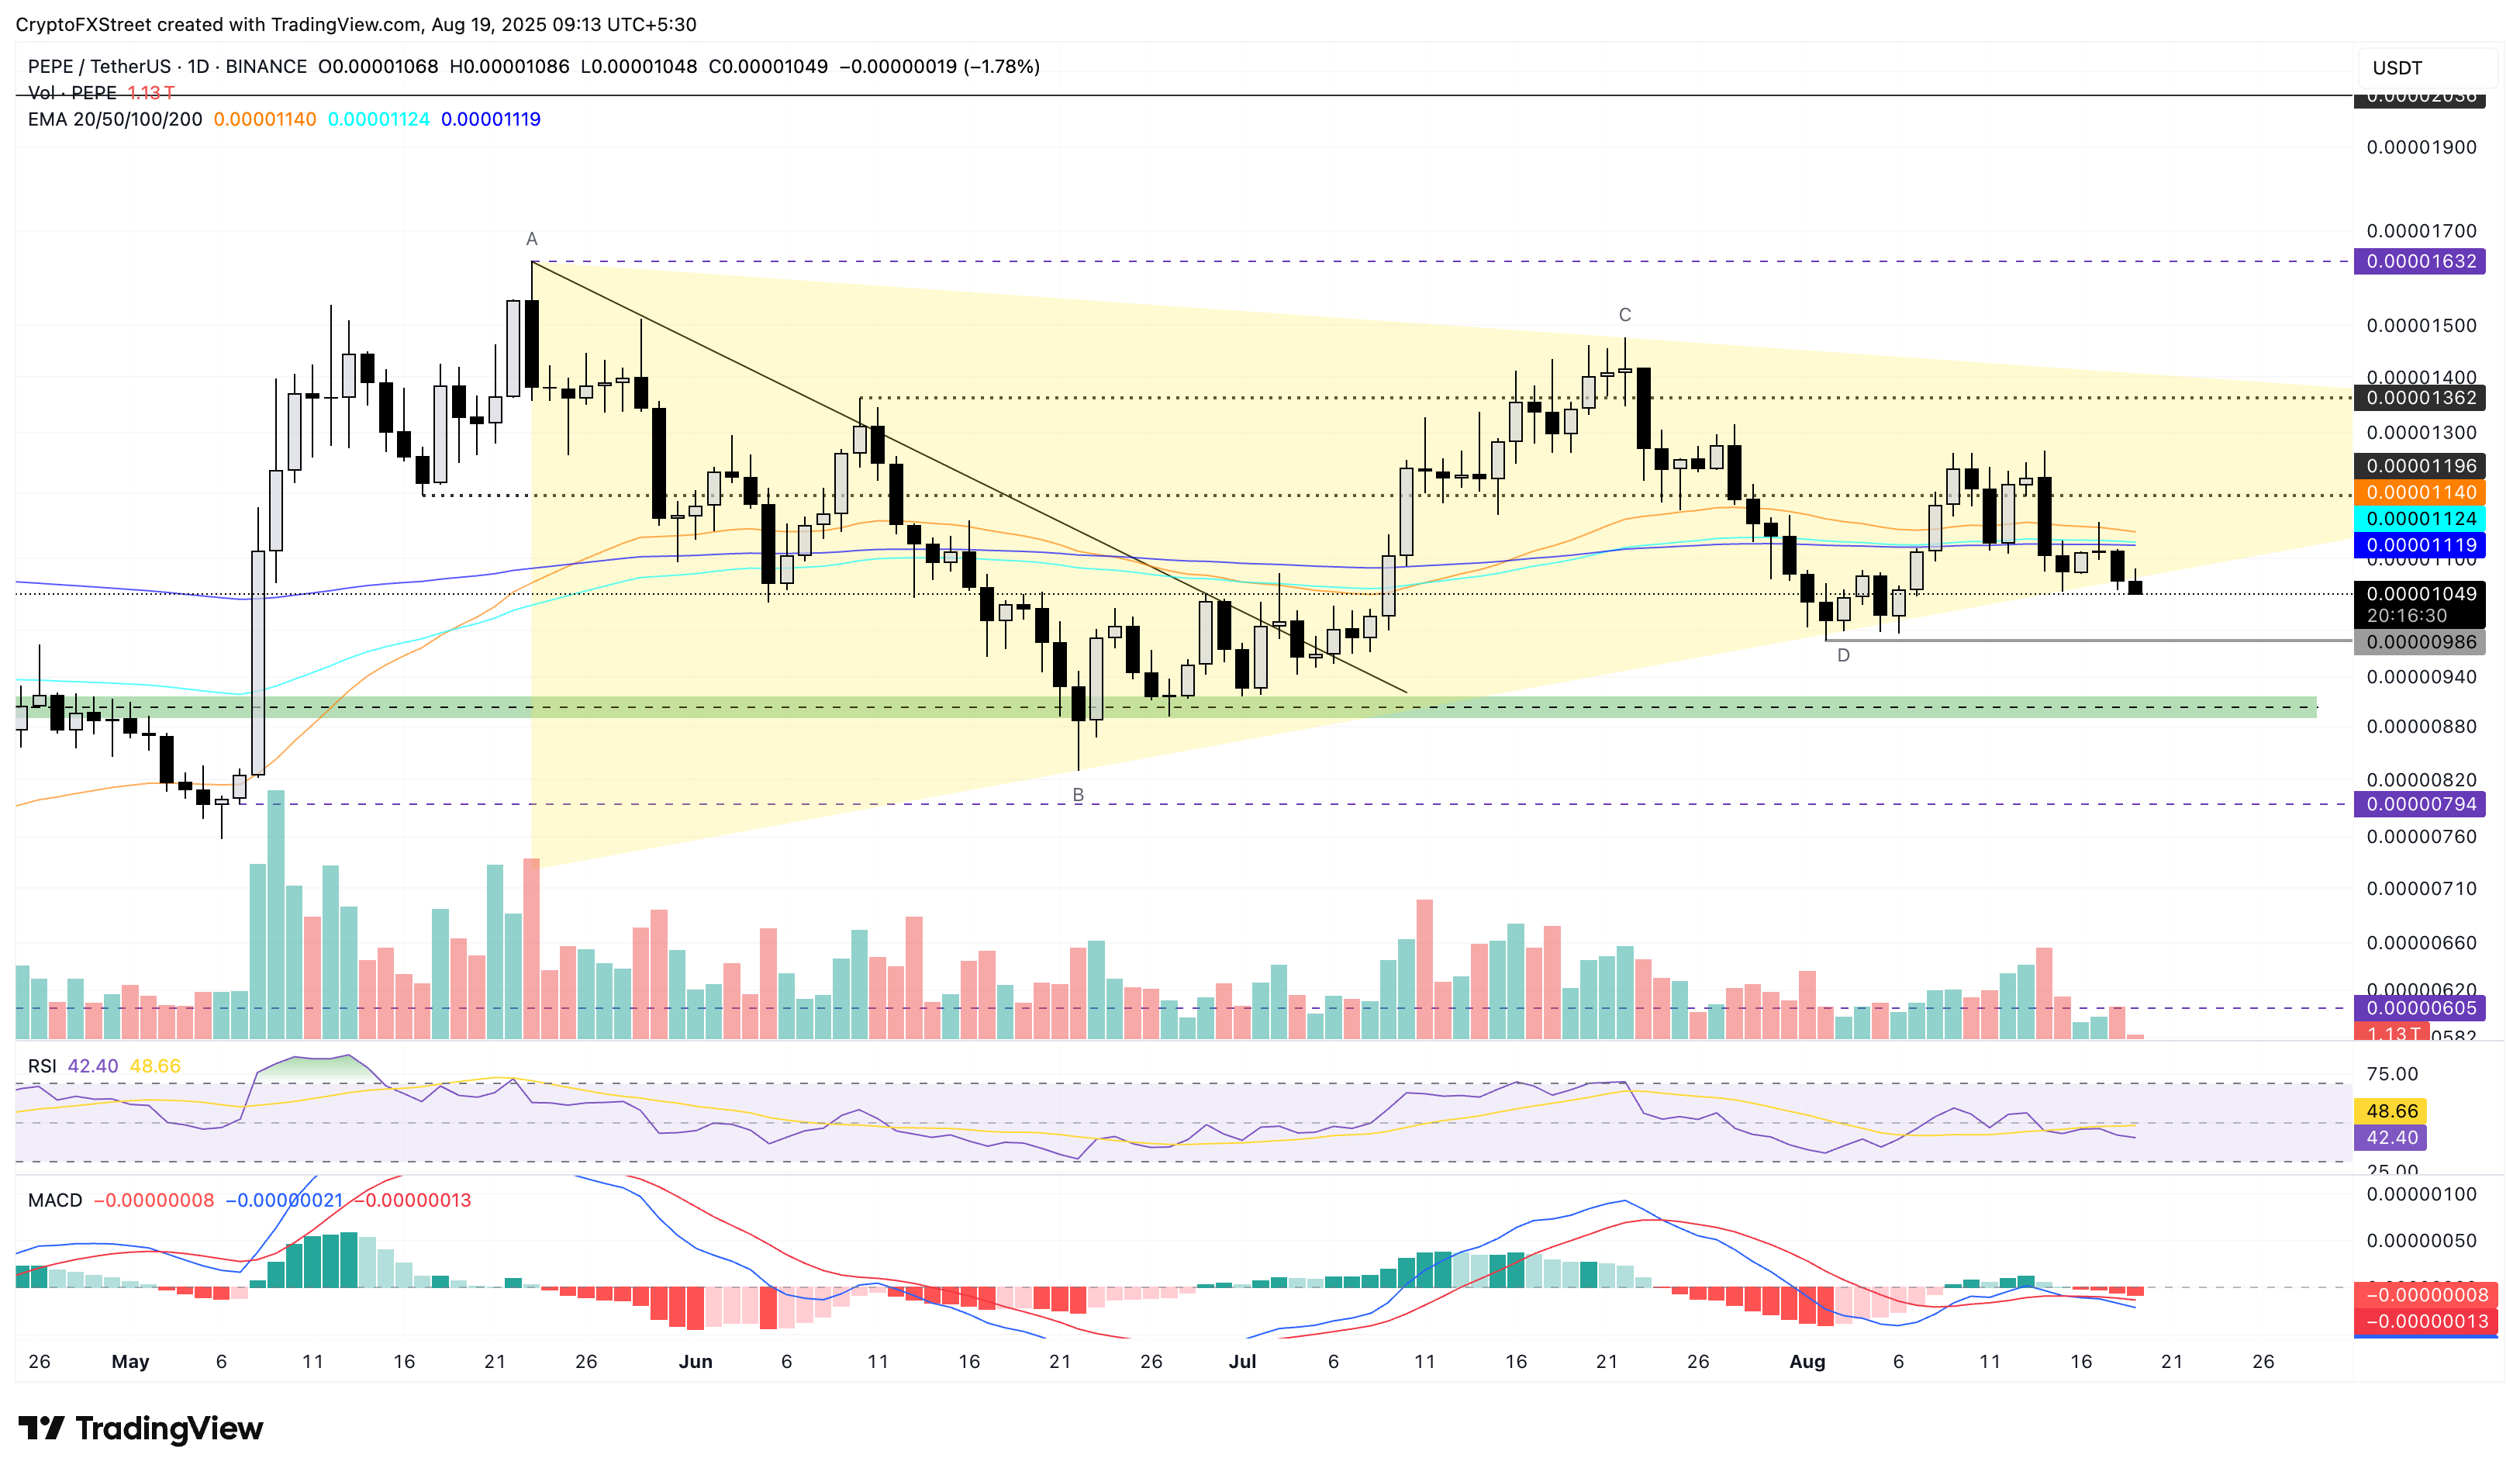
Similar to SHIB, Pepe risks a symmetrical triangle breakdown on the daily chart (shared below). The frog-themed meme coin edges lower by over 1% at press time on Tuesday, extending the 3.96% fall from the previous day.
A bearish close to the day would mark the pattern breakdown, potentially losing the $0.00001000 psychological support to test the $0.00000986 level.
The momentum indicators maintain a bearish bias, as the MACD and its signal line decline following the crossover on Saturday. Additionally, the RSI at 42 on the daily chart drifts lower as risk tilts lower.
The 50- and 200-day EMA moving close to each other risk a Death Cross as PEPE declines. A crossover would signal a sell opportunity for sidelined traders, aligning with the fallout from the triangle pattern.
PEPE/USDT daily price chart.
On the flipside, PEPE should reclaim the 200-day EMA at $0.00001120 to regain the bullish trend.
Author

Vishal Dixit
FXStreet
Vishal Dixit holds a B.Sc. in Chemistry from Wilson College but found his true calling in the world of crypto.