MATIC price reclaims $1 as investors make bullish moves following 37% recovery
- MATIC price is nearing the $1.13 price level, breaching it will reignite the altcoin’s rally.
- On the macro scale, MATIC is still maintaining the uptrend that began five months ago.
- The recent upsurge in investors’ presence indicates MATIC holders are still maintaining a bullish outlook.

MATIC price noted one of the highest increases earlier this month when the cryptocurrency rallied by 43.91% to trade at $1.25. However, this rise was short-lived as the altcoin sank to $0.81 following the market-wide crash. Regardless, its holders have kept their positivity up, which is visible in their movement over the last 24 hours.
MATIC price heading towards its highs
MATIC price recovered by 37.55% on November 10, bringing the altcoin back above $1, which has been an important psychological support. From here on, the cryptocurrency is looking to reclaim $1.13 as a support level, as it had been previously tested during MATIC’s 43% rally.
If the price manages to break through and flip $1.13 into support, it will be able to resume its rally toward its next critical resistance at $1.32. This level was last tested in April this year, and an upswing to it would recover significant losses experienced by investors in the previous seven months.
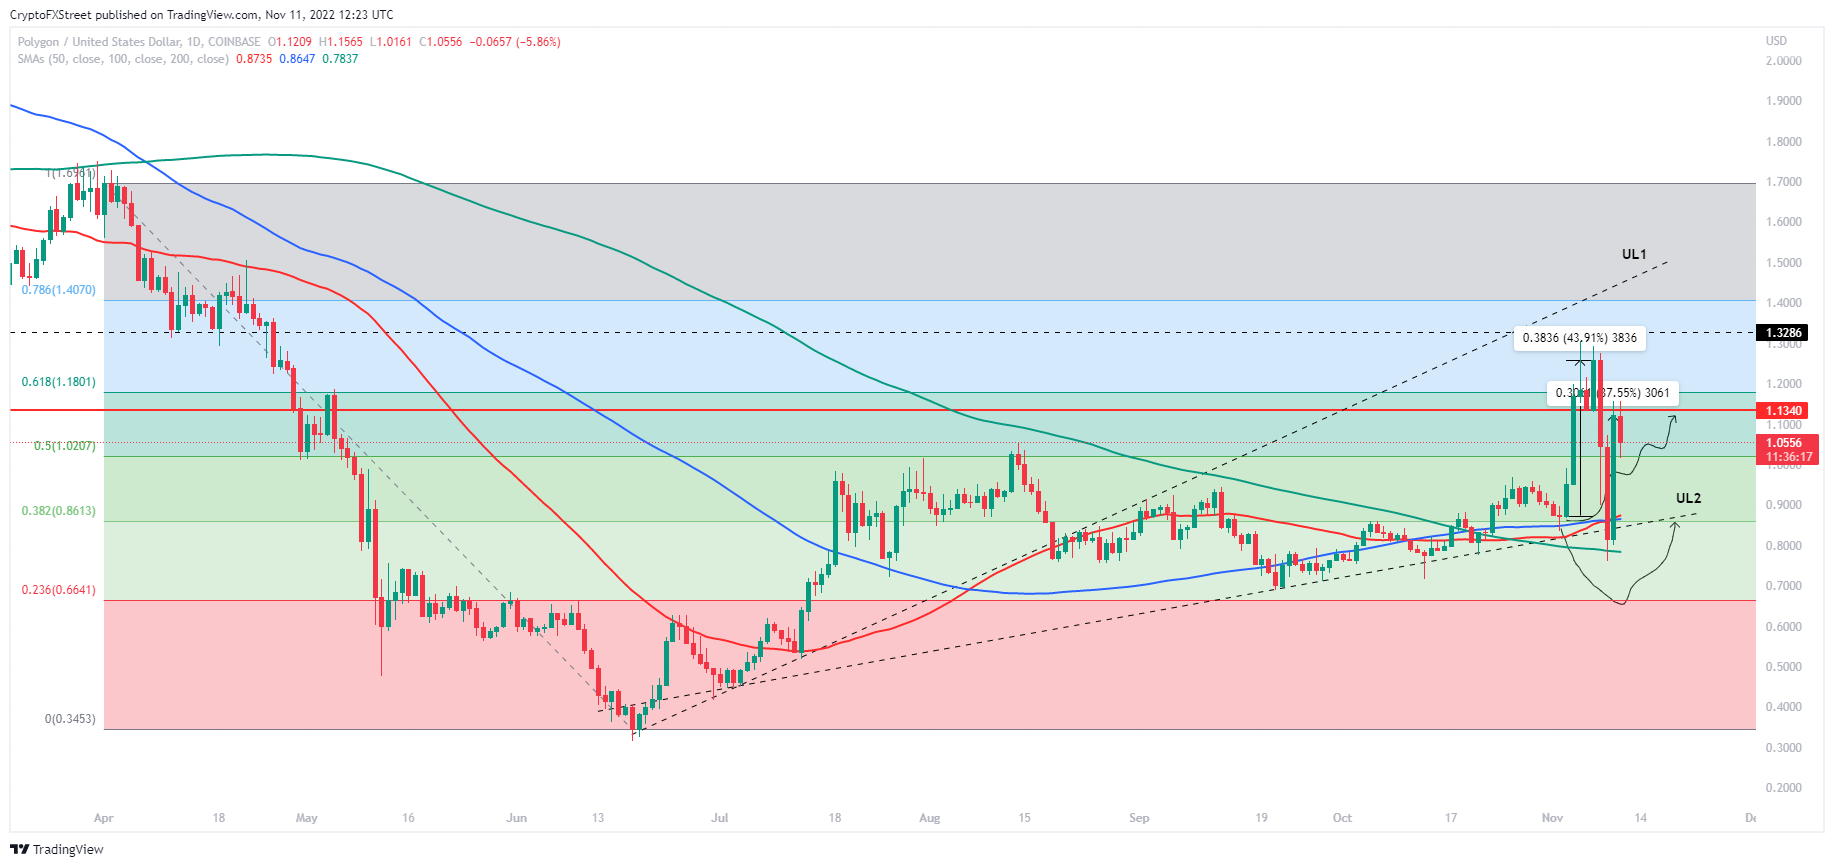
MATICUSD 1-day chart
Such an upswing will only be possible if investors maintain their current bullish momentum, which still remains intact despite November 8’s crash. Most of the activity observed on-chain was during November 10’s recovery and not November 9’s decline. Active addresses noted an 84% increase as transaction volume in a single day almost touched $300 million.
 [18.32.08, 11 Nov, 2022]-638037705285314549.png)
MATIC holder activity
Should these figures continue improving, MATIC could note a further rally over the next couple of days. However, in the event that broader market cues favor the bears and MATIC paints a red candle, the altcoin could lose its $1 support.
In that case, the next critical support will be around $0.87 to $0.90, which coincides with the micro uptrend line. A bounce from here would reset a recovery for MATIC (ref. MATICUSD 1-day chart).
Author

Aaryamann Shrivastava
FXStreet
Aaryamann Shrivastava is a Cryptocurrency journalist and market analyst with over 1,000 articles under his name. Graduated with an Honours in Journalism, he has been part of the crypto industry for more than a year now.


