MATIC price rally to pause at $1.80 before continuing higher
- MATIC price approaches a weekly resistance level, warning of a pause in further upside potential.
- A bullish breakout is still likely, but a slight pullback or consolidation phase is more probable.
- Downside risks continue to decrease but remain a concern in the near term.

MATIC price action has moved inside the Ichimoku Cloud for the first time since January 20, 2022, giving bulls hope that further expansion moves higher may continue. However, the $1.80 zone may temporarily halt the current rally.
MATIC price continues to surge higher, but a bump in the road may slow its rise
MATIC price recently crossed above the 38.2% Fibonacci retracement of the all-time high to the low of the strong bar in May 2021 at $1.60. MATIC is now just below the weekly Tenkan-Sen at $1.67, which might generate a slight pause for bulls, but given the extreme slope of the weekly Tenkan-Sen (not shown), it is unlikely to create much resistance.
The critical resistance level for MATIC price is between $1.80 and $1.85. The 50% Fibonacci retracement at $1.80 and the top of the Ichimoku Cloud (Senkou Span B) at $1.85 are likely to create a headache for bulls, specifically Senkou span B.
Senkou Span B is the strongest resistance level with the Ichimoku Kinko Hyo system. It is very difficult to close above Senkous Span B, and that difficulty is exacerbated when Senkou Span B is flat for long periods. Additionally, the thickness of the Ichimoku Cloud further increases the resistance of Senkou Span B.
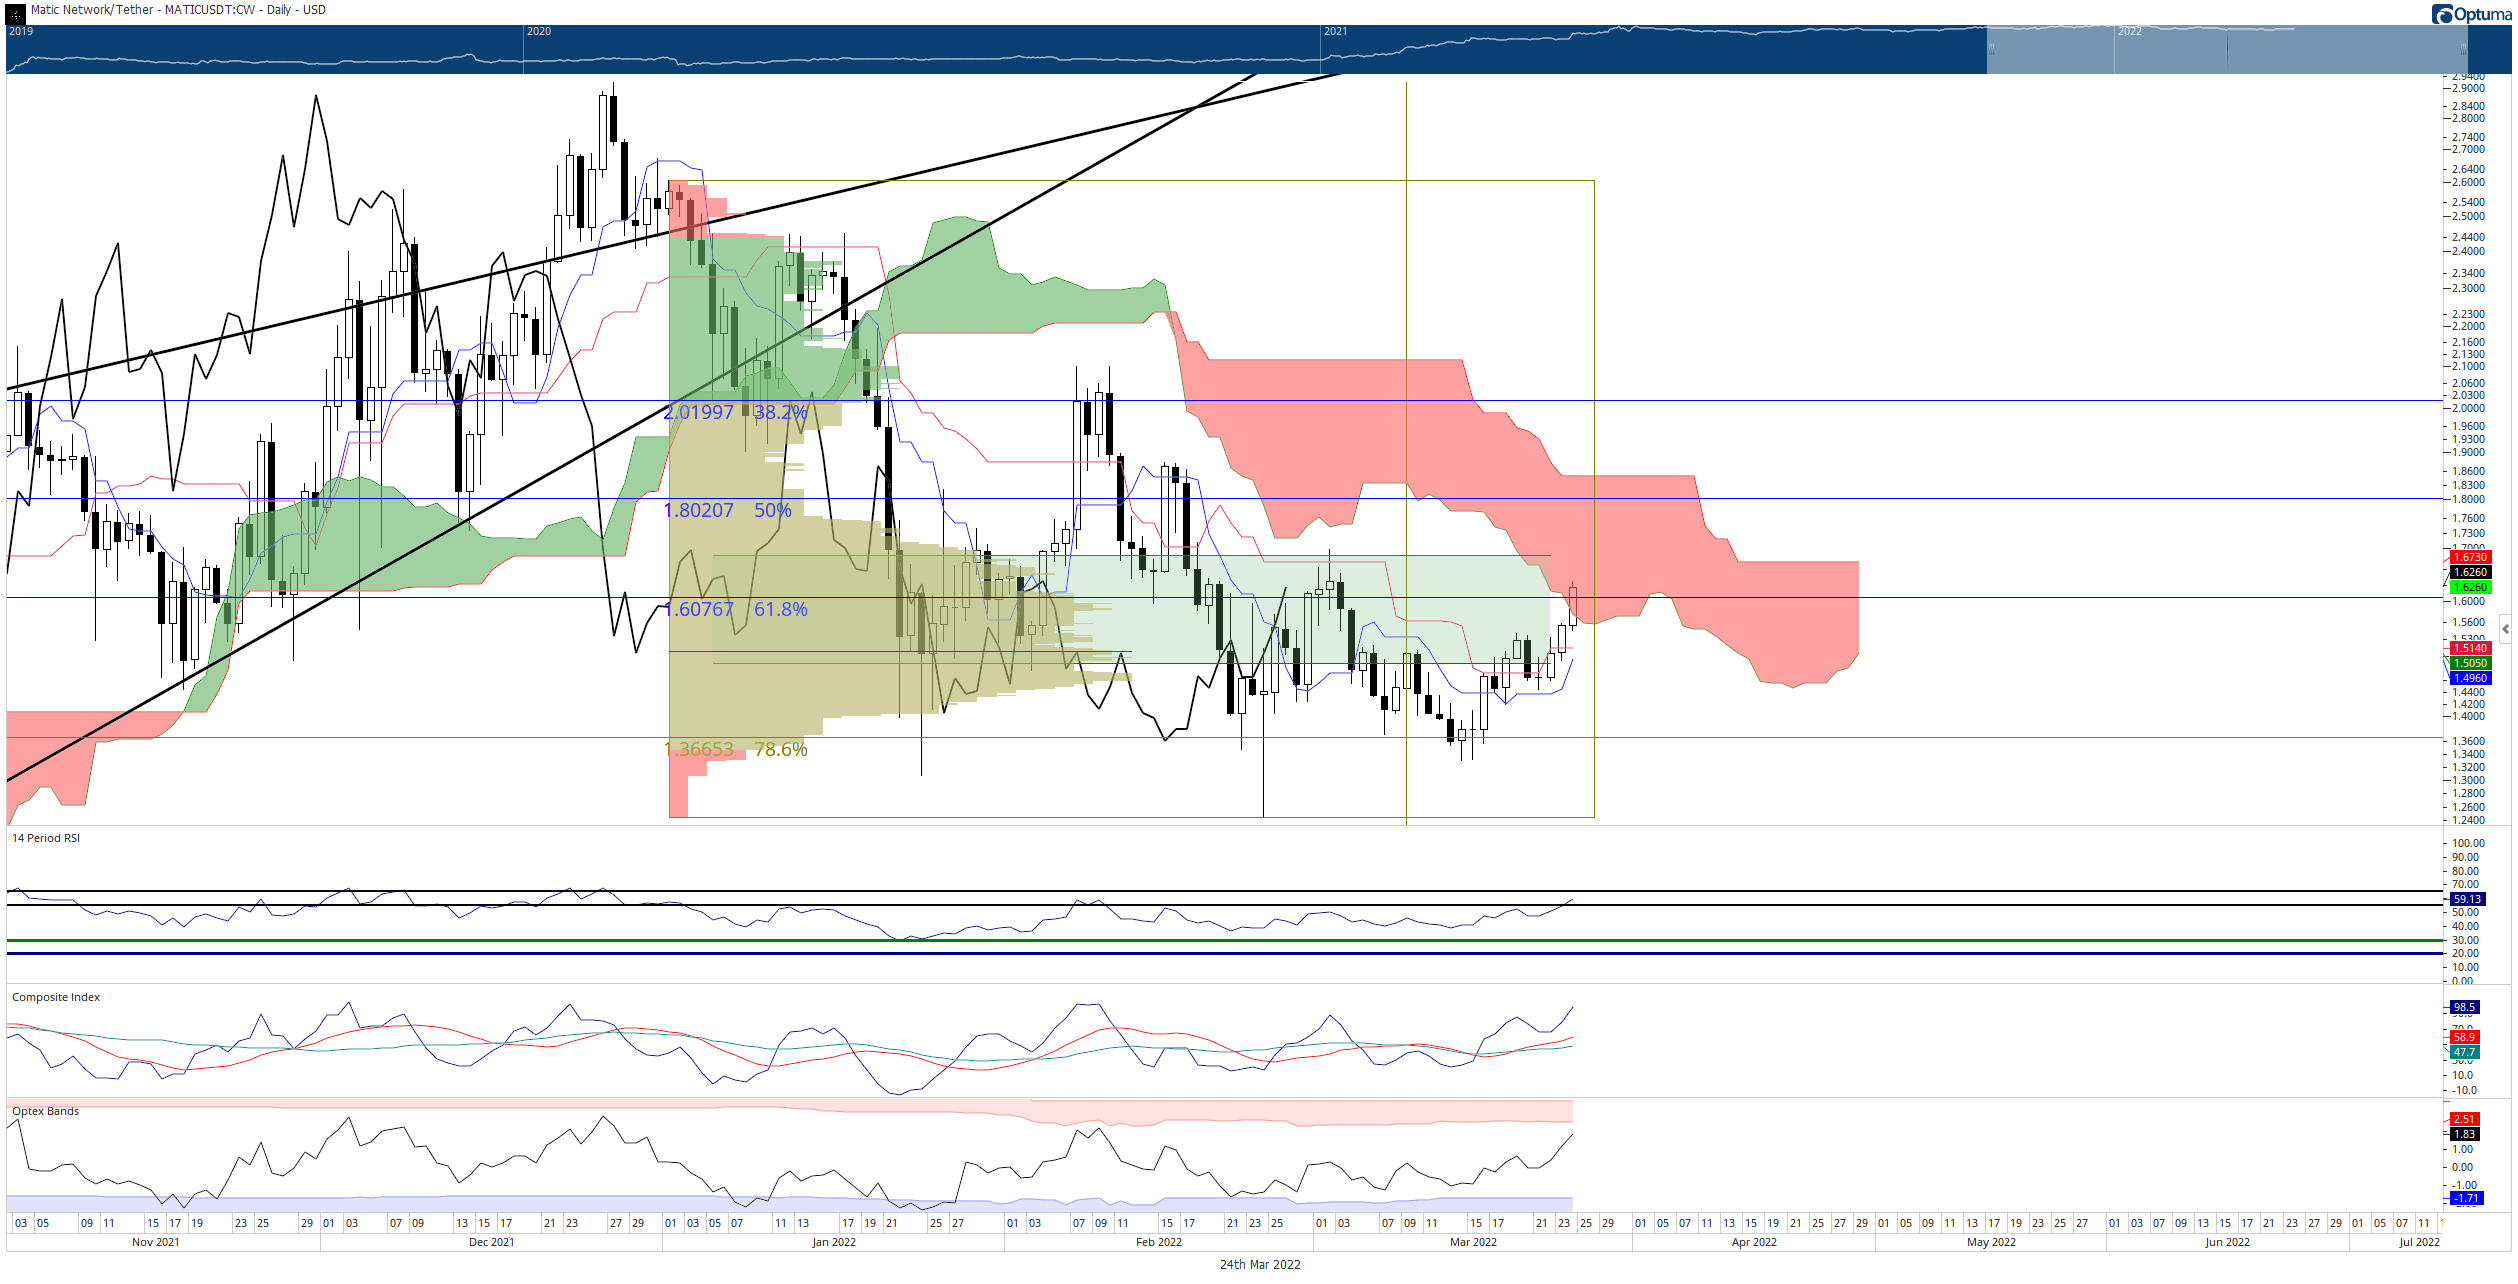
MATIC/USDT Daily Ichimoku Kinko Hyo Chart
If MATIC price bulls want to see a clear bullish expansion phase, then MATIC price will first need to confirm an Ideal Bullish Ichimoku breakout. That will be confirmed once MATIC price closes above the Ichimoku Cloud at or above $1.8575. That represents a needed gain of nearly 20% from today’s open.
Downside risks are likely limited to the recent swing lows at the 78.6% Fibonacci retracement ($1.36).
Author

Jonathan Morgan
Independent Analyst
Jonathan has been working as an Independent future, forex, and cryptocurrency trader and analyst for 8 years. He also has been writing for the past 5 years.


