MATIC price awaits bulls to return it to $1.00
- MATIC price action continues to recover from its most recent collapse.
- Polygon bulls are struggling to create the same amount of gains seen by its peers.
- A rare and powerful bullish entry setup is confirmed on MATIC's Point and Figure chart.

MATIC price has bounced over 43% from yesterday's new 2022 lows. Further upside potential is likely to continue, but downside risks remain a concern.
MATIC price poised to retest $1
MATIC price is setting up for a strong retracement on its daily and weekly Ichimoku charts. As a result, bulls should have a relatively clear path to test the critical $0.80 value area before testing $1.
A theoretical long opportunity for MATIC exists with a buy stop order at $0.76, a stop loss at $0.71, and a profit target at $1.03. The trade idea represents a 5.4:1 reward for the risk. Because of the range between the entry and the projected profit target, a three-box trailing stop would help protect any profit made post entry.
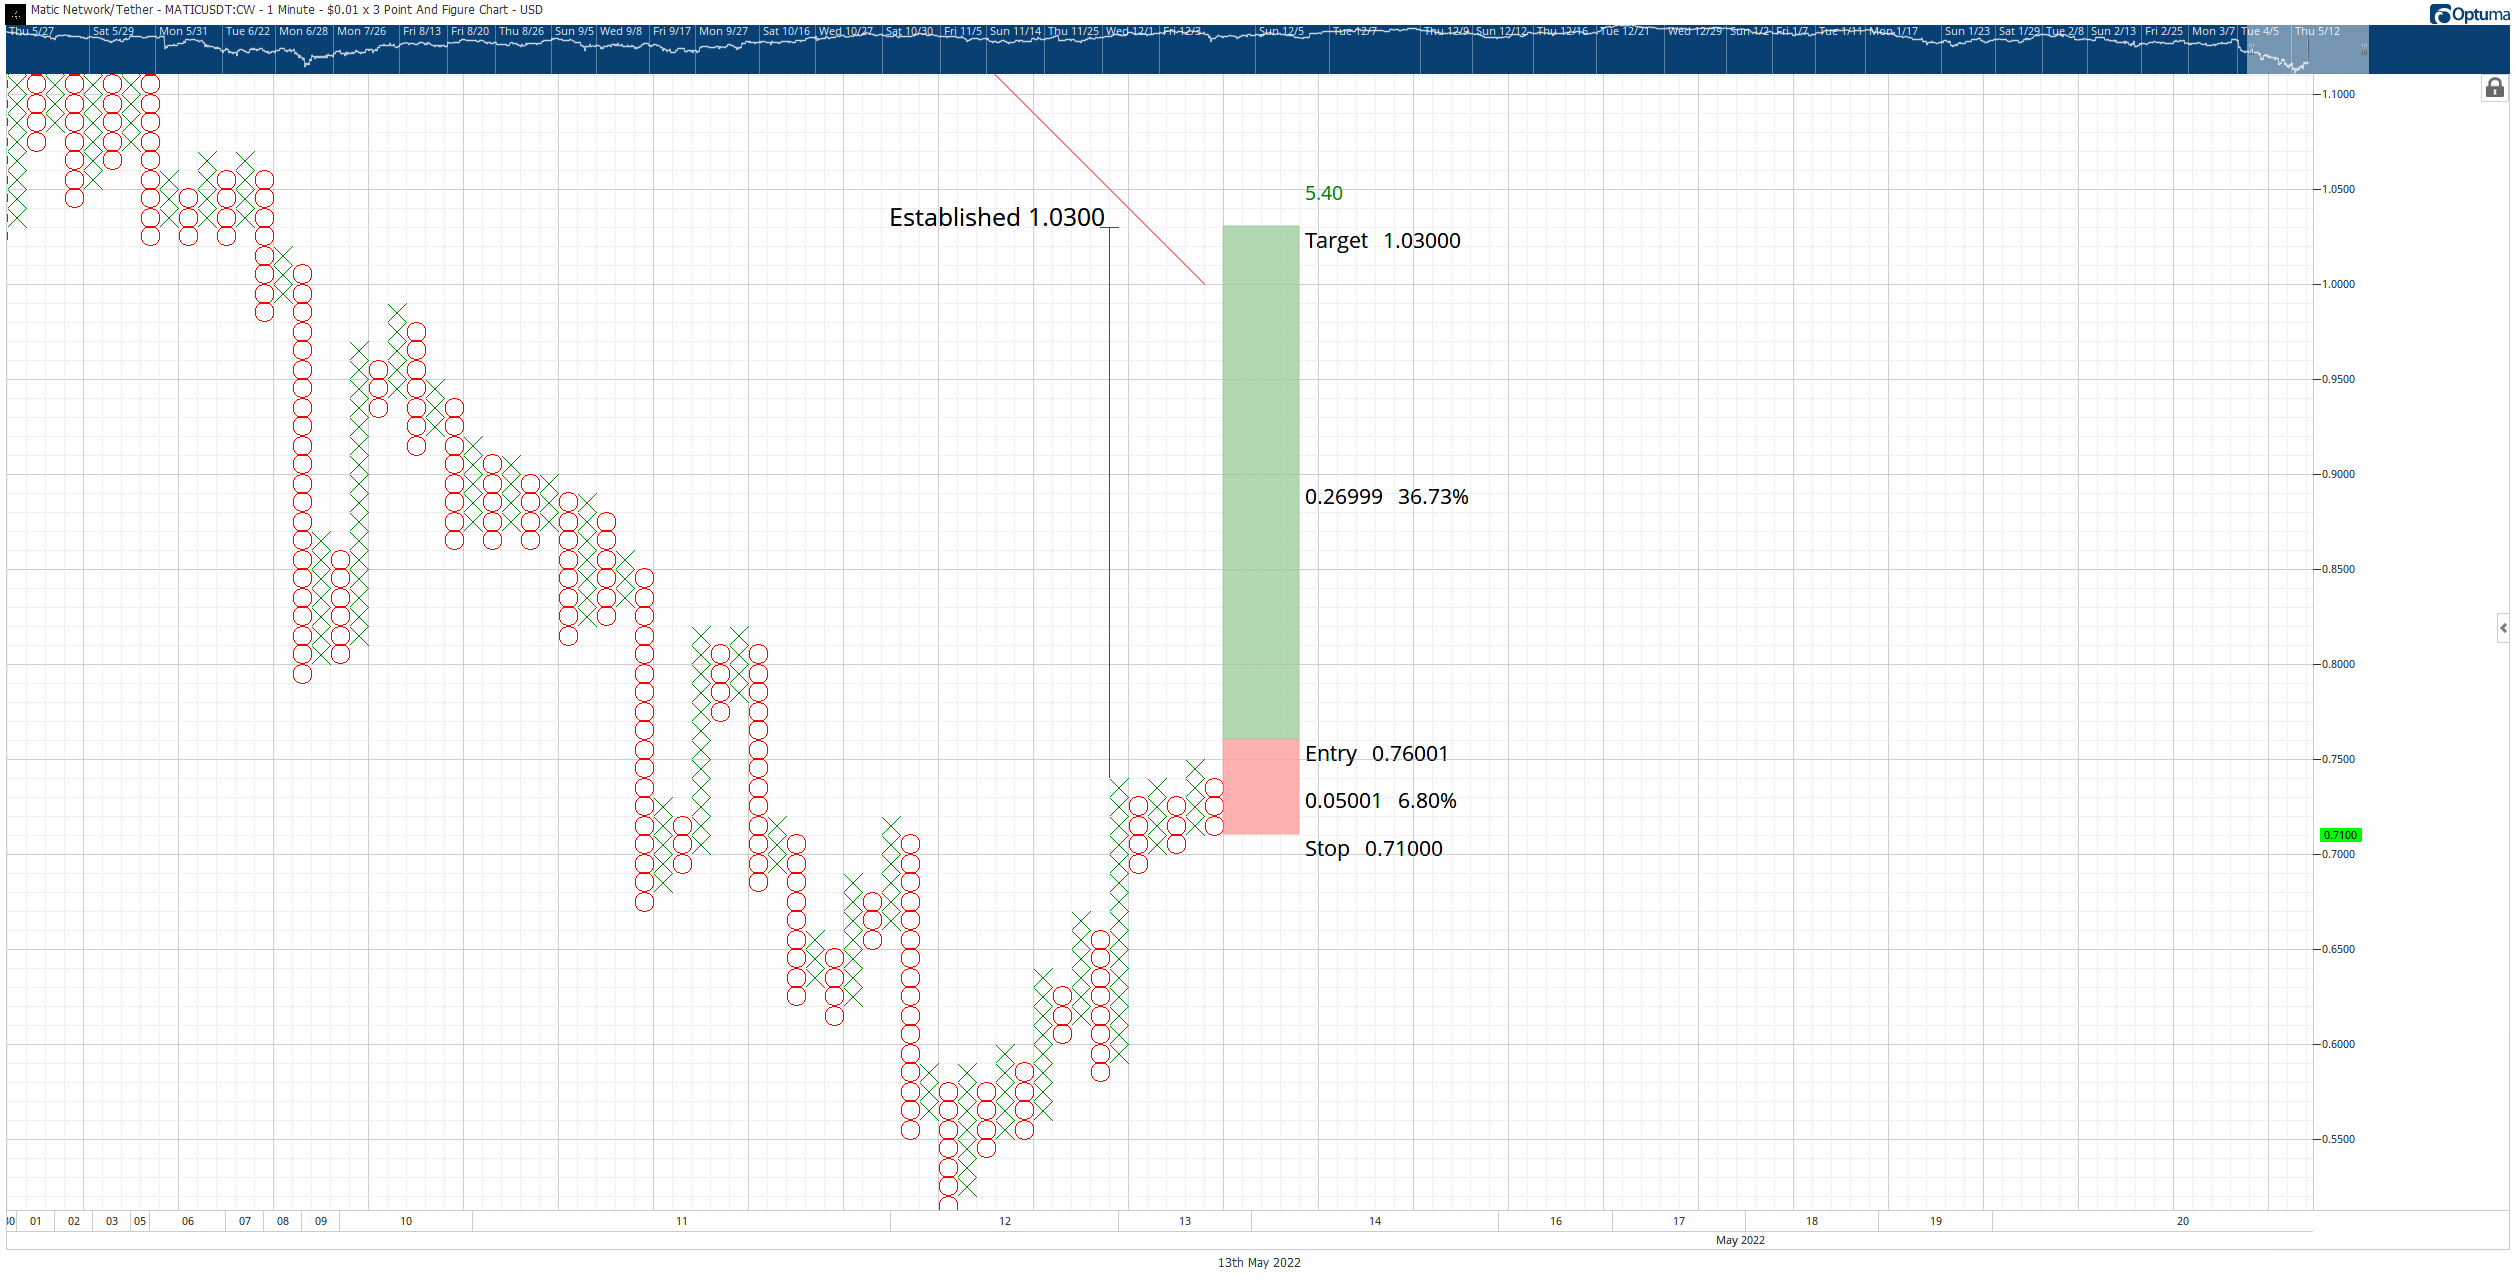
MATIC/USDT $0.01/3-box Reversal Point and Figure Chart
The long setup is based on the most powerful and bullish pattern in Point and Figure Analysis: the Bullish Catapult. It's powerful because of specific criteria for its construction and how it creates a false sense of hope for short-sellers.
First, there must be a breakout above a triple-top – a very bullish significant event. However, the breakout can not exceed three boxes above the triple-top. Next, price action must reverse from the breakout and form another column of Os – but this column of Os can't break below the prior O-column. Finally, the last column of Xs forms, and the entry is on the breakout above the double-top.
What makes this pattern powerful is how it affects short sellers. Short sellers who see a rally fizzle out after breaking out from a substantial resistance level have a good reason to open new short positions or add to existing ones. The fall collects more MATIC price short-sellers who anticipate a breakdown. Instead, buyers trickle back in and trap the short-sellers. Additionally, the entry brings in many conservative traders waiting to enter on the sidelines.
Downside risks do exist. The immediate threat for MATIC price is a continuation move south to the next high volume node in the 2021 Volume Profile at $0.38.
Author

Jonathan Morgan
Independent Analyst
Jonathan has been working as an Independent future, forex, and cryptocurrency trader and analyst for 8 years. He also has been writing for the past 5 years.



