MATIC outperforms Bitcoin and Ethereum, Polygon targets $3 and new all-time highs
- MATIC price action moves counter to the broader cryptocurrency market and rallies.
- MATIC was positioned perfectly for a catalyst to rally it higher.
- A new all-time highest weekly close is on the horizon.

MATIC price action has been in a bullish tear, trading to the inverse of nearly every other cryptocurrency. Consequently, it was positioned perfectly for a rally and is now on track to create a new all-time highest weekly close.
MATIC price rallies during sell-off for these three following reasons
MATIC price had cleared a significant hurdle in its drive towards new all-time highs. The first reason for the recent rally is the breakout above $1.74. $1.74 is where the 61.8% Fibonacci Retracement and the final high volume node in the 2021 volume profile exist. A clear break and close above $1.75 means MATIC has an easier time moving up than it does moving down. The volume profile thins considerably above $2.00.
The second reason for the rally is the conversion from bear market levels in the RSI to bull market levels. MATIC price has traded in bear market conditions in the Relative Strength Index since mid-August. However, buyers have tested the final overbought level of 65 a total of six times since October 13th. With the breakout above 65 in the Relative Strength Index and a move to 70, the RSI shifts into bull market conditions.
The third and final reason for the rally is one that some traders might miss. The all-time high for MATIC price is $2.44, but the all-time highest close is $1.82. Therefore, it is very likely that buyers are positioning MATIC for a new all-time highest close on the weekly chart. This would be a significant event for MATIC and would likely create a launching pad for higher prices.
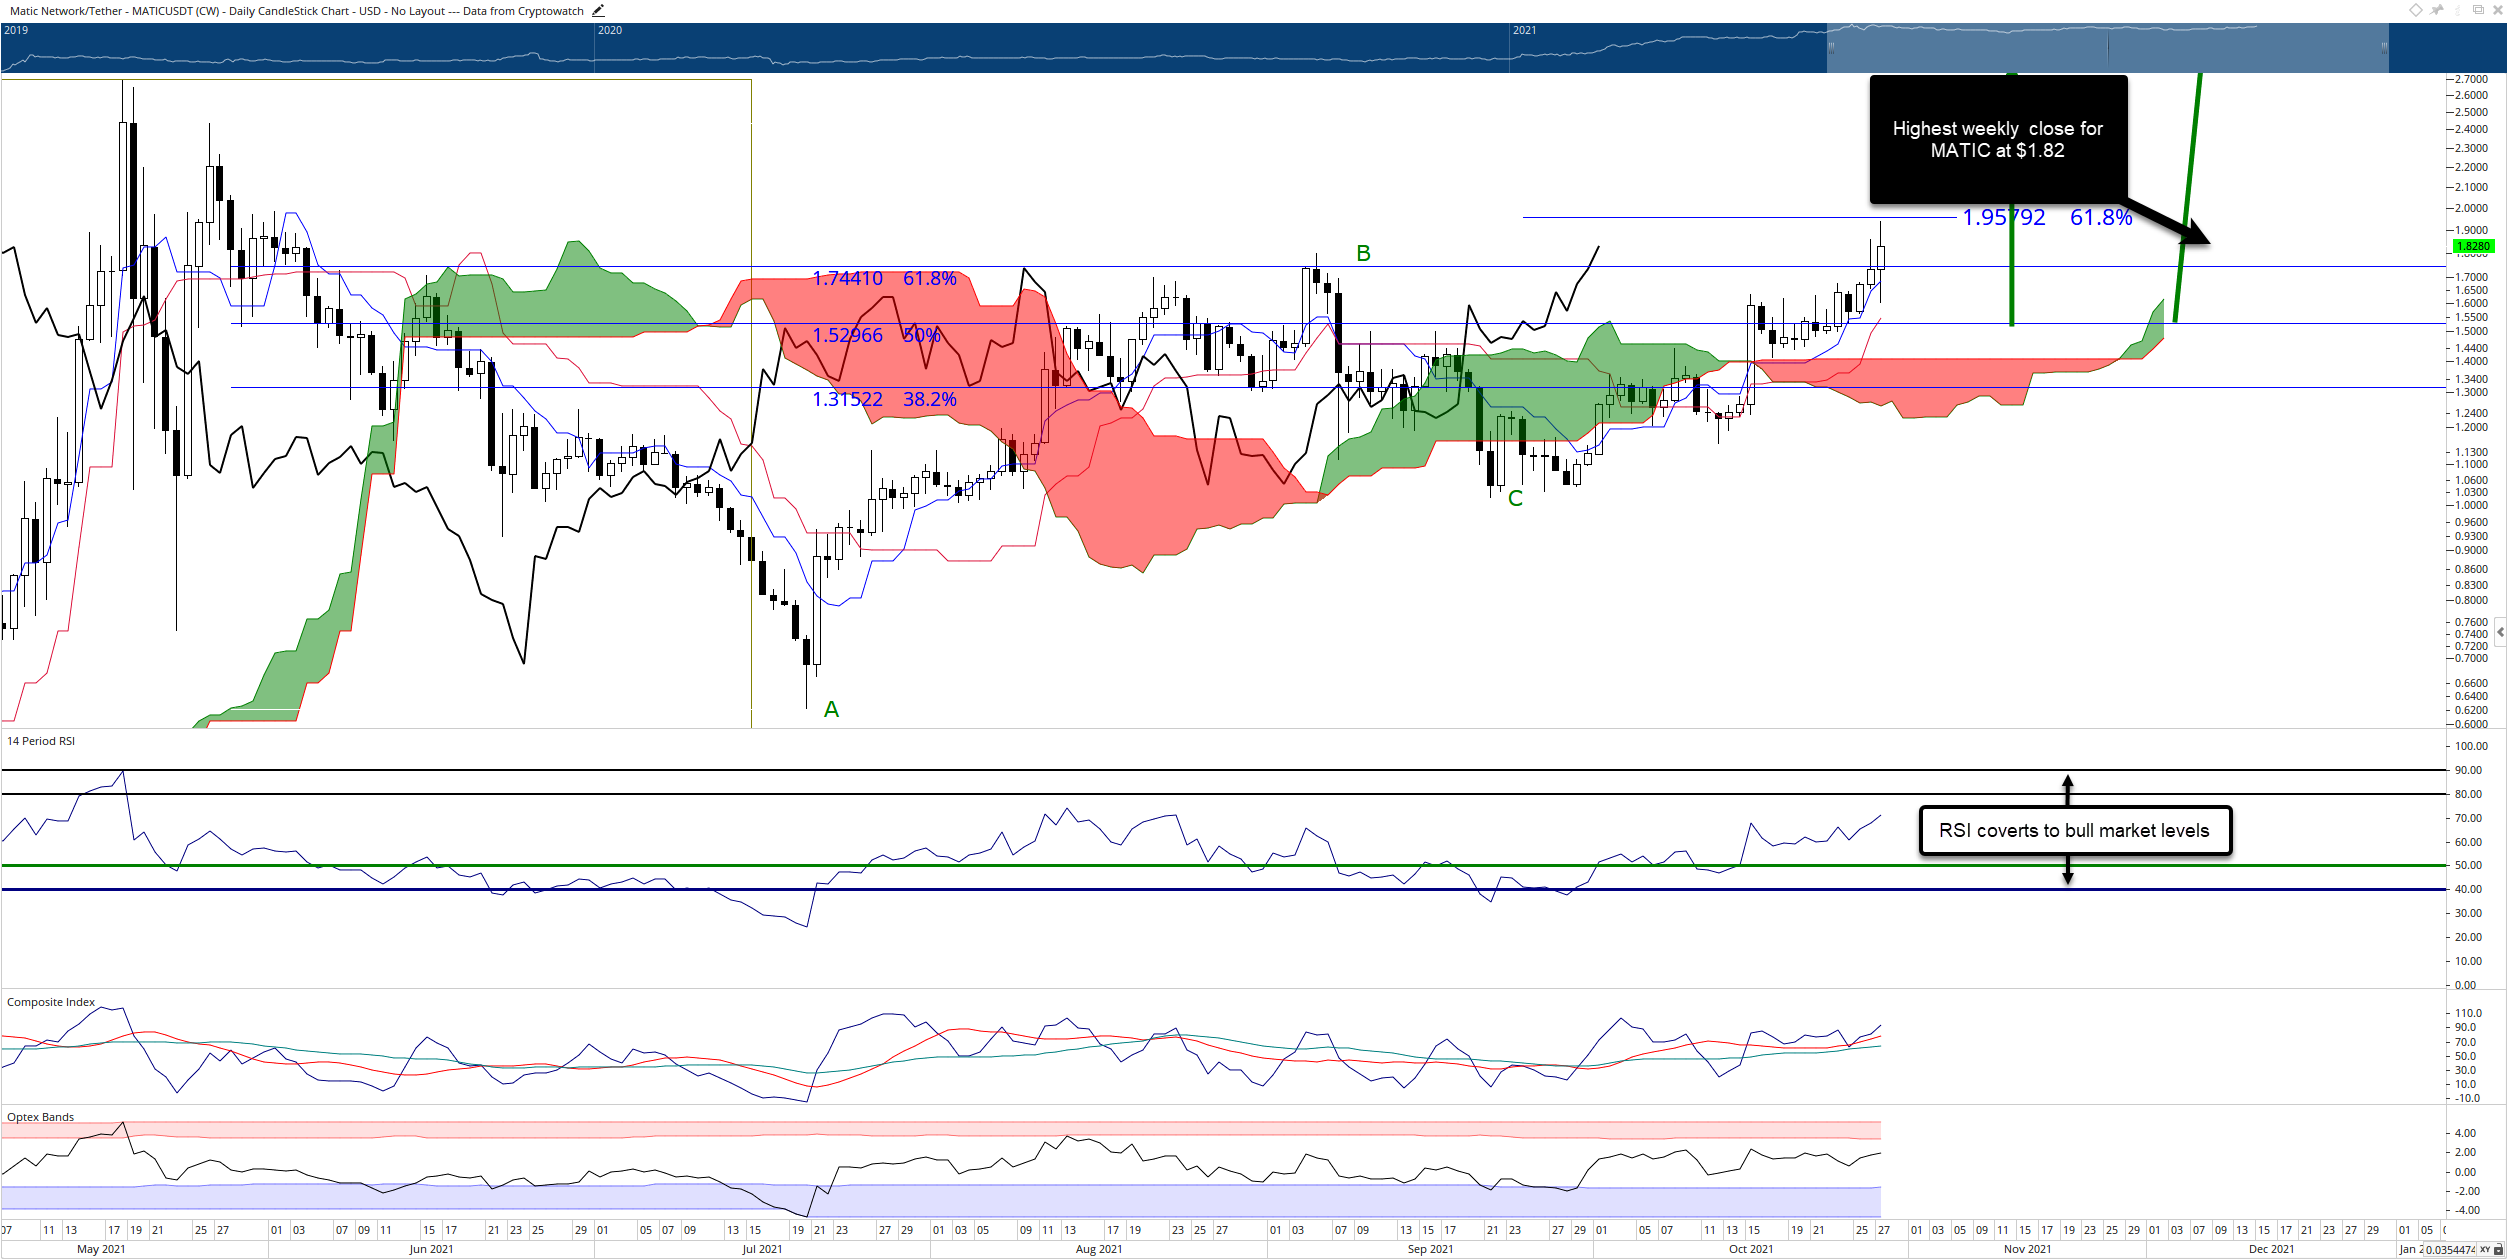
MATIC/USDT Daily Ichimoku Chart
However, caution should be practiced. MATIC price needs sustained buying pressure and bullish conviction to maintain these new multi-month highs. If buyers fail to support MATIC, the result will likely be a bull trap, and a flash crash towards the $0.80 level is likely.
Author

Jonathan Morgan
Independent Analyst
Jonathan has been working as an Independent future, forex, and cryptocurrency trader and analyst for 8 years. He also has been writing for the past 5 years.


