Mantle Price Forecast: MNT eyes 200-day EMA breakout for further gains
- Mantle ticks lower after three consecutive days of uptrend, targeting the 200-day EMA breakout.
- The rising MNT Open Interest suggests increased confidence in the derivatives market.
- The technical outlook is sending mixed signals as the wedge breakout rally approaches the 200-day EMA.

Mantle (MNT) edges lower by over 1% at press time on Tuesday after three consecutive days of gains, while the optimism holds in the derivatives market, reflected by heightened Open Interest. The technical outlook gives mixed signals as the bullish run in MNT approaches the dynamic resistance of the 200-day Exponential Moving Average.
Rising MNT Open Interest signals heightened optimism
Open Interest (OI) of a cryptocurrency refers to the total value of active positions in the derivatives market. Typically, an increase in OI suggests heightened capital inflow, a sign of increased trading activities.
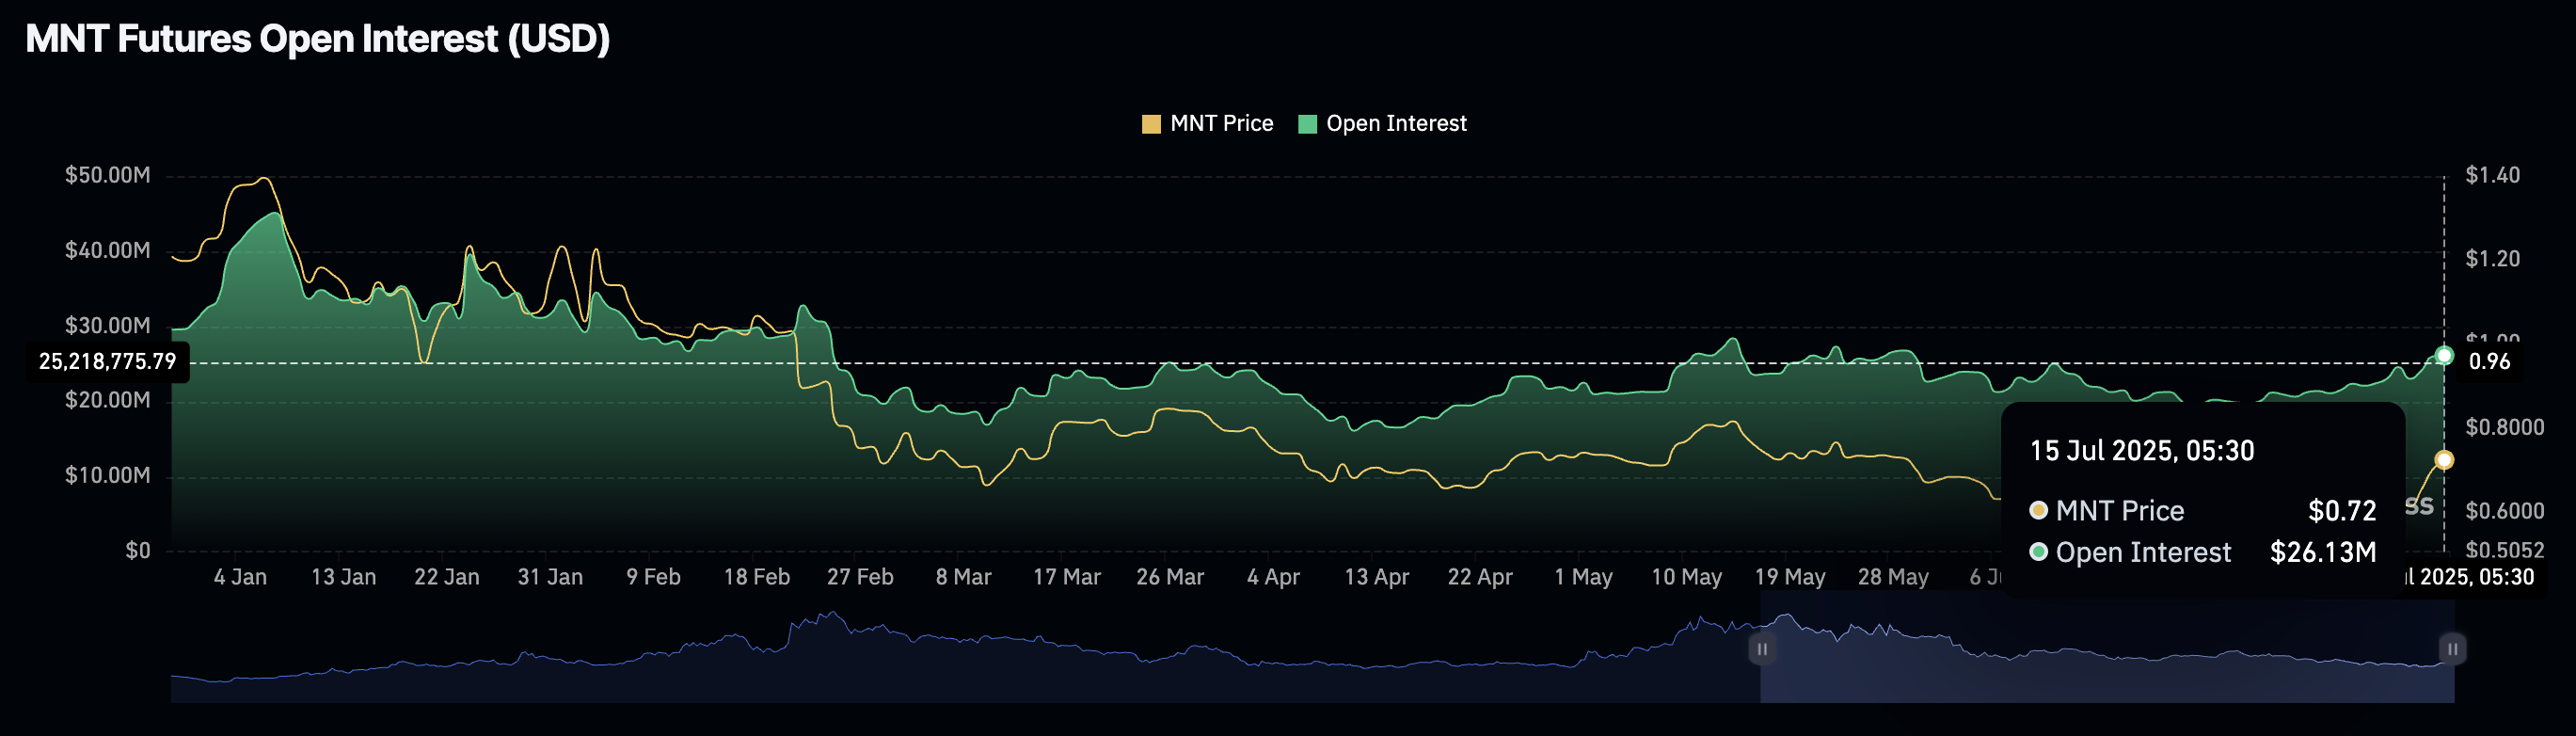
MNT Open Interest. Source: Coinglass
CoinGlass’ data shows an 18% rise in the MNT Open Interest of $21.63 million over the last week.
Bullish run in Mantle faces a crucial dynamic resistance
Mantle trades between the 100-day and 200-day EMAs at $0.6869 and $0.7485, respectively, while holding dominance above the 23.6% Fibonacci retracement level at $0.6903, drawn between the January 6 high at $1.4198 and the July 1 low at $0.5524.
Mantle’s falling wedge breakout rally, as shown on the daily chart below, aims to surpass the 200-day EMA. A decisive close above the dynamic resistance could extend the uptrend to the 50% Fibonacci level at $0.8856.
The Relative Strength Index (RSI) reads 69 on the daily chart, slightly below the overbought zone, suggesting increased buying pressure.
The Moving Average Convergence/Divergence (MACD) indicator displays a rising trend in the green histogram bars above the zero line, indicating increased bullish momentum. Further, the uptrend in the MACD and its signal line crossing into the positive territory suggests a trend reversal.
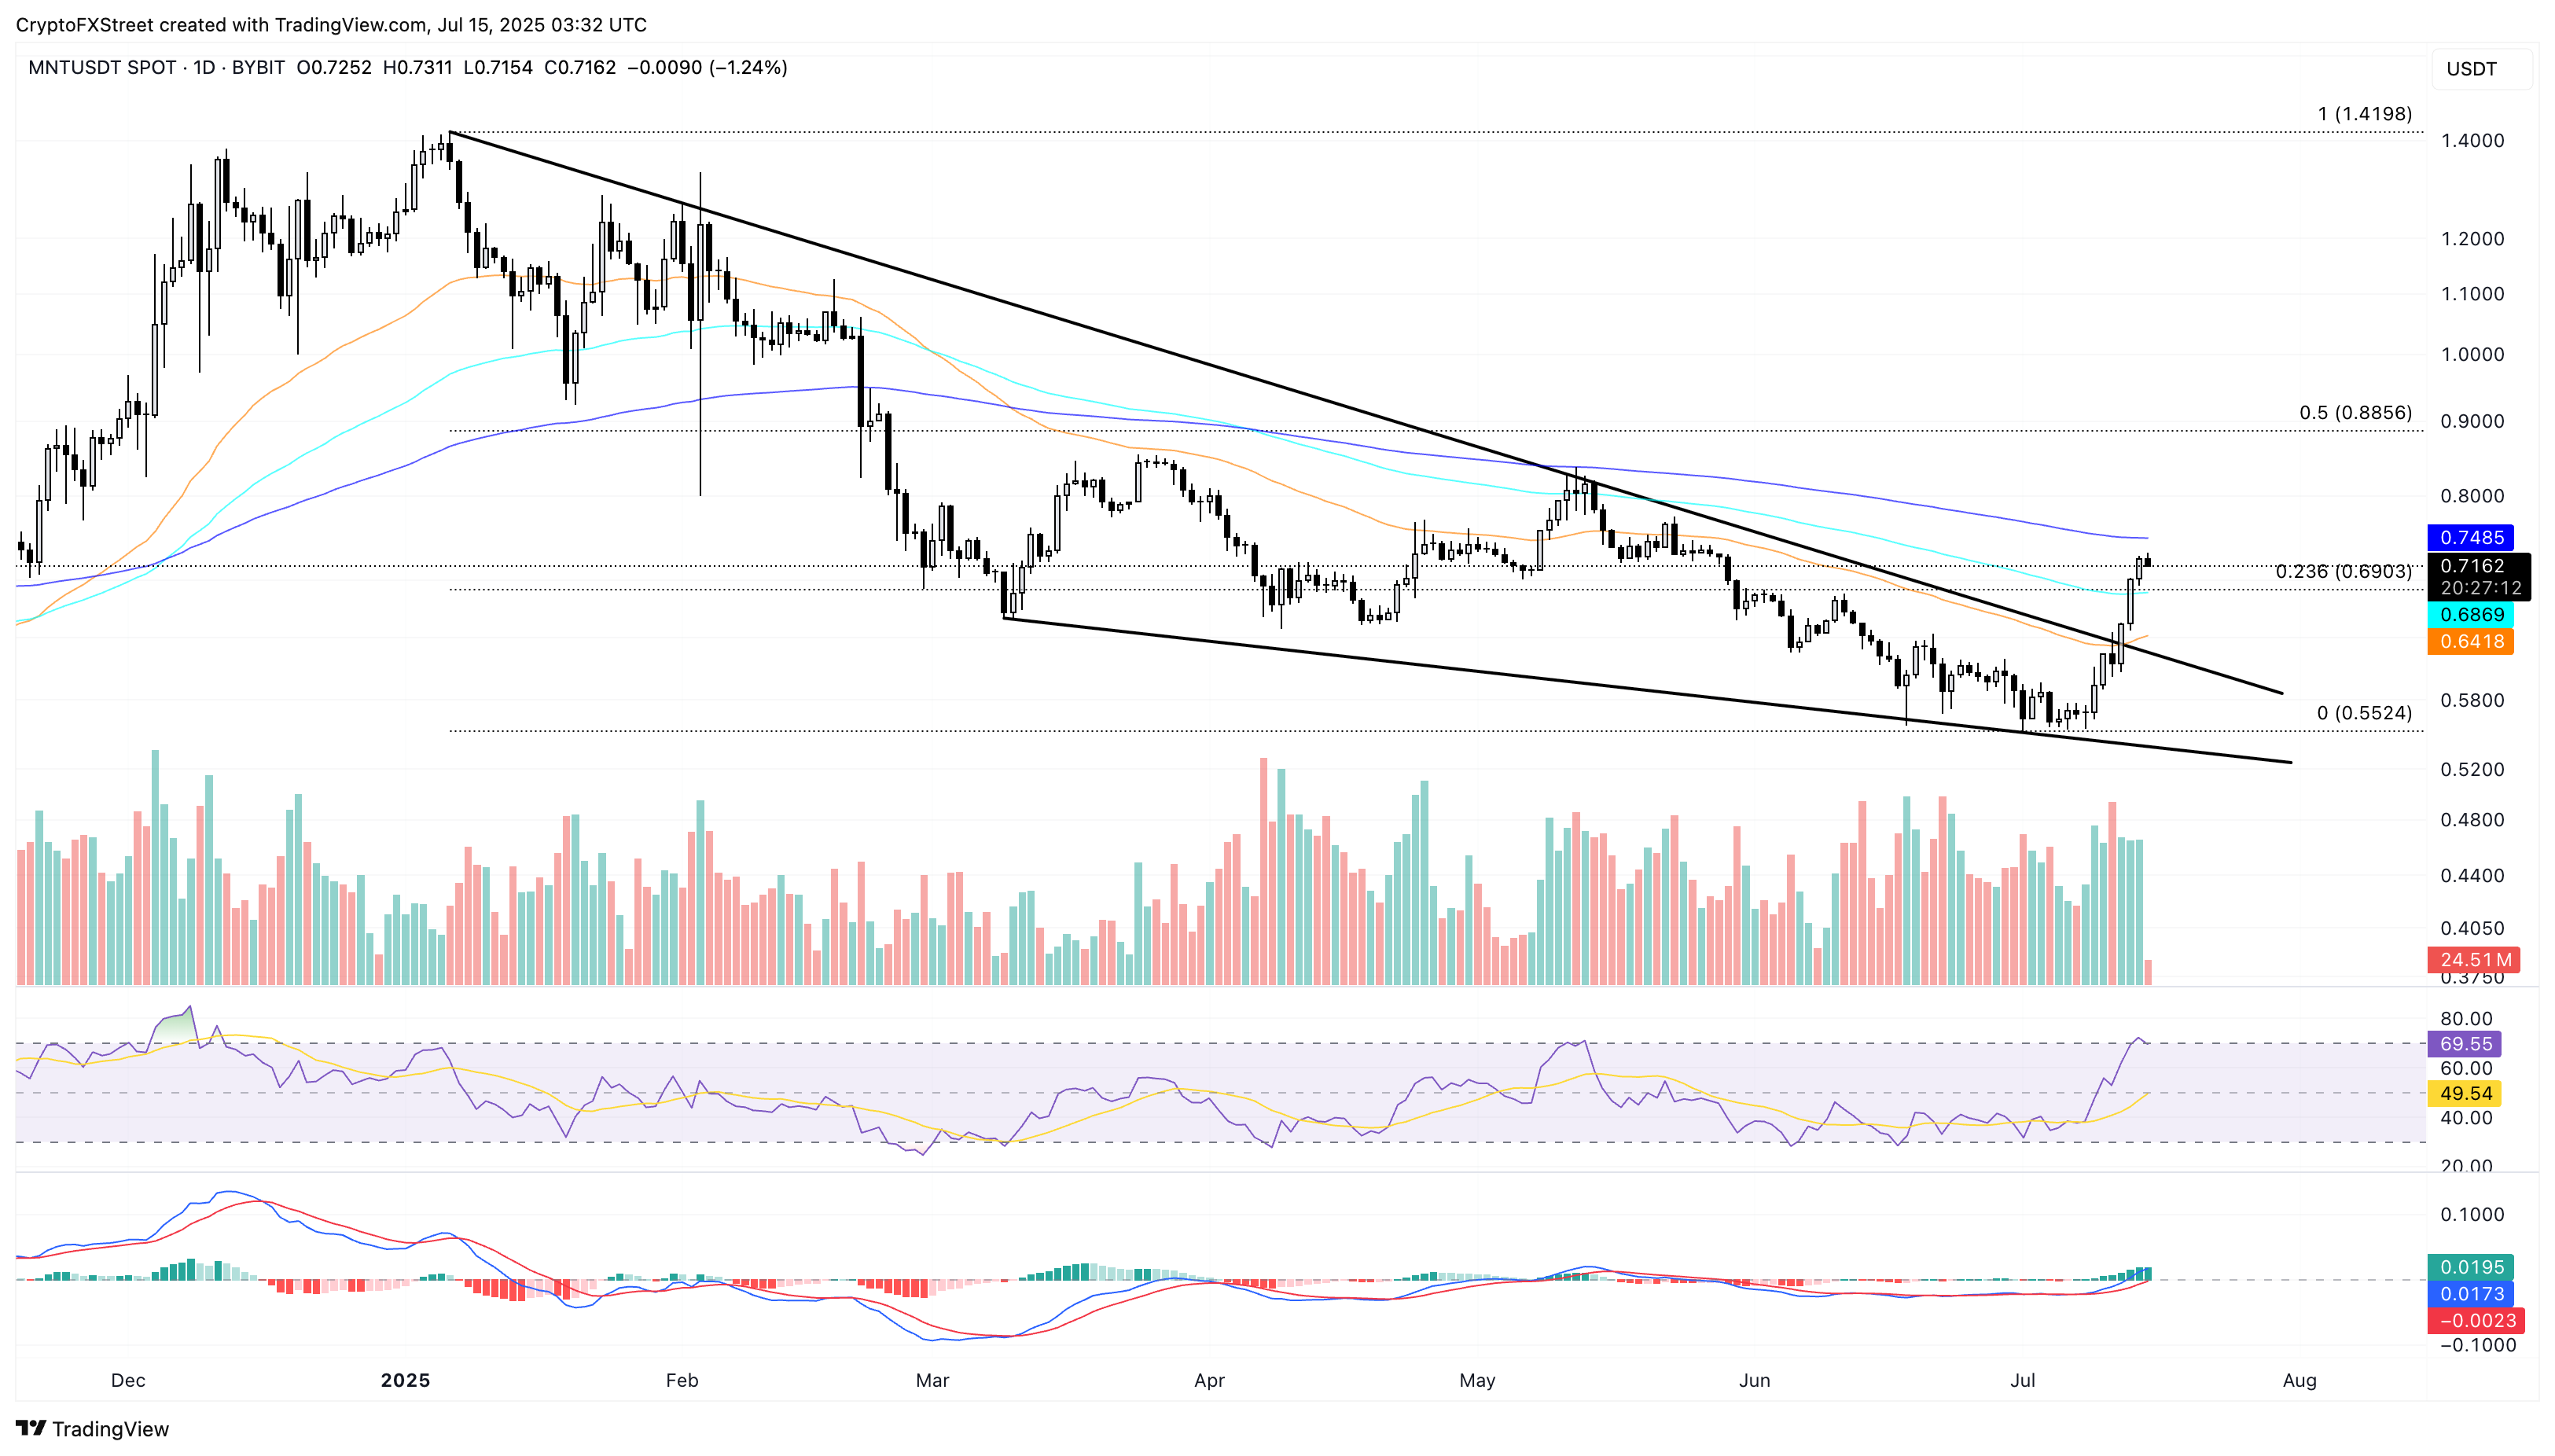
If MNT reverses from the 200-day EMA, it could retest the 23.6% Fibonacci level at $0.6903.
Author

Vishal Dixit
FXStreet
Vishal Dixit holds a B.Sc. in Chemistry from Wilson College but found his true calling in the world of crypto.


