Maker Price Analysis: MKR on-chain metrics say prices are ready to shoot
- Maker (MKR) on-chain metrics show that the price is ready for a recovery.
- The technical picture supports the bullish forecast.

Maker (MKR) is the 35th largest digital asset with a current market capitalization of $560 million and an average daily trading volume of $19 million. At the time of writing, the coin is changing hands at $558, down nearly 2% since this time on Monday. Despite the recent retreat, MKR has gained over 18% on a month-to-month basis.
Maker (MKR) is the governance token of the MakerDAO and Maker Protocol. The coin is most actively traded against USDT on such cryptocurrency trading platforms as Bilaxy and MXC.
On-chain metrics promise a bright future for MKR
Considering the on-chain metrics, such as daily active addresses and age consumed indicator, MKR may be ready for a bullish breakout. Let's have a closer look at the data to see what's going on.
MKR: Daily active addresses
 [14.40.46, 20 Oct, 2020]-637387931870831019.png)
Source: Santiment
As the chart above shows, the number of active addresses within the Maker's network has been growing steadily since the beginning of October amid rather consolidative price movements. At the beginning of the month, the figure hit the historically high level of 2,281 address and stayed elevated based on historical data. This momentum can be interpreted as a bullish signal, as it means that traders tend to increase their interaction with the network.
Meanwhile, the Age Consumed indicator registered a spike at the end of the previous week. The development has not resulted in any significant movements as of yet. This indicator does not allow us to define the direction of the potential price movement, though it means that a lot of dormant coins came to motion. Considering the steady exchange balances and range-bound price action, we may suggest that MKR may be ready for a bullish breakthrough.
MKR: Age consumed
 [14.56.16, 20 Oct, 2020]-637387932057516373.png)
Source: Santiment
MKR/USD: The technical picture
Meanwhile, the technical picture implies that MKR bulls might need to tread with caution as the price is testing the hypotenuse of an ascending triangle pattern at $555. Once it is sustainably broken, the sell-off may be extended with the first aim at $430, which is the measured target of the bearish breakthrough outside the triangle pattern. This area also served as a backstop for the coin on numerous occasions in 2020, meaning that the bears will have a hard time pushing the price lower.
MKR/USD 12-hour chart
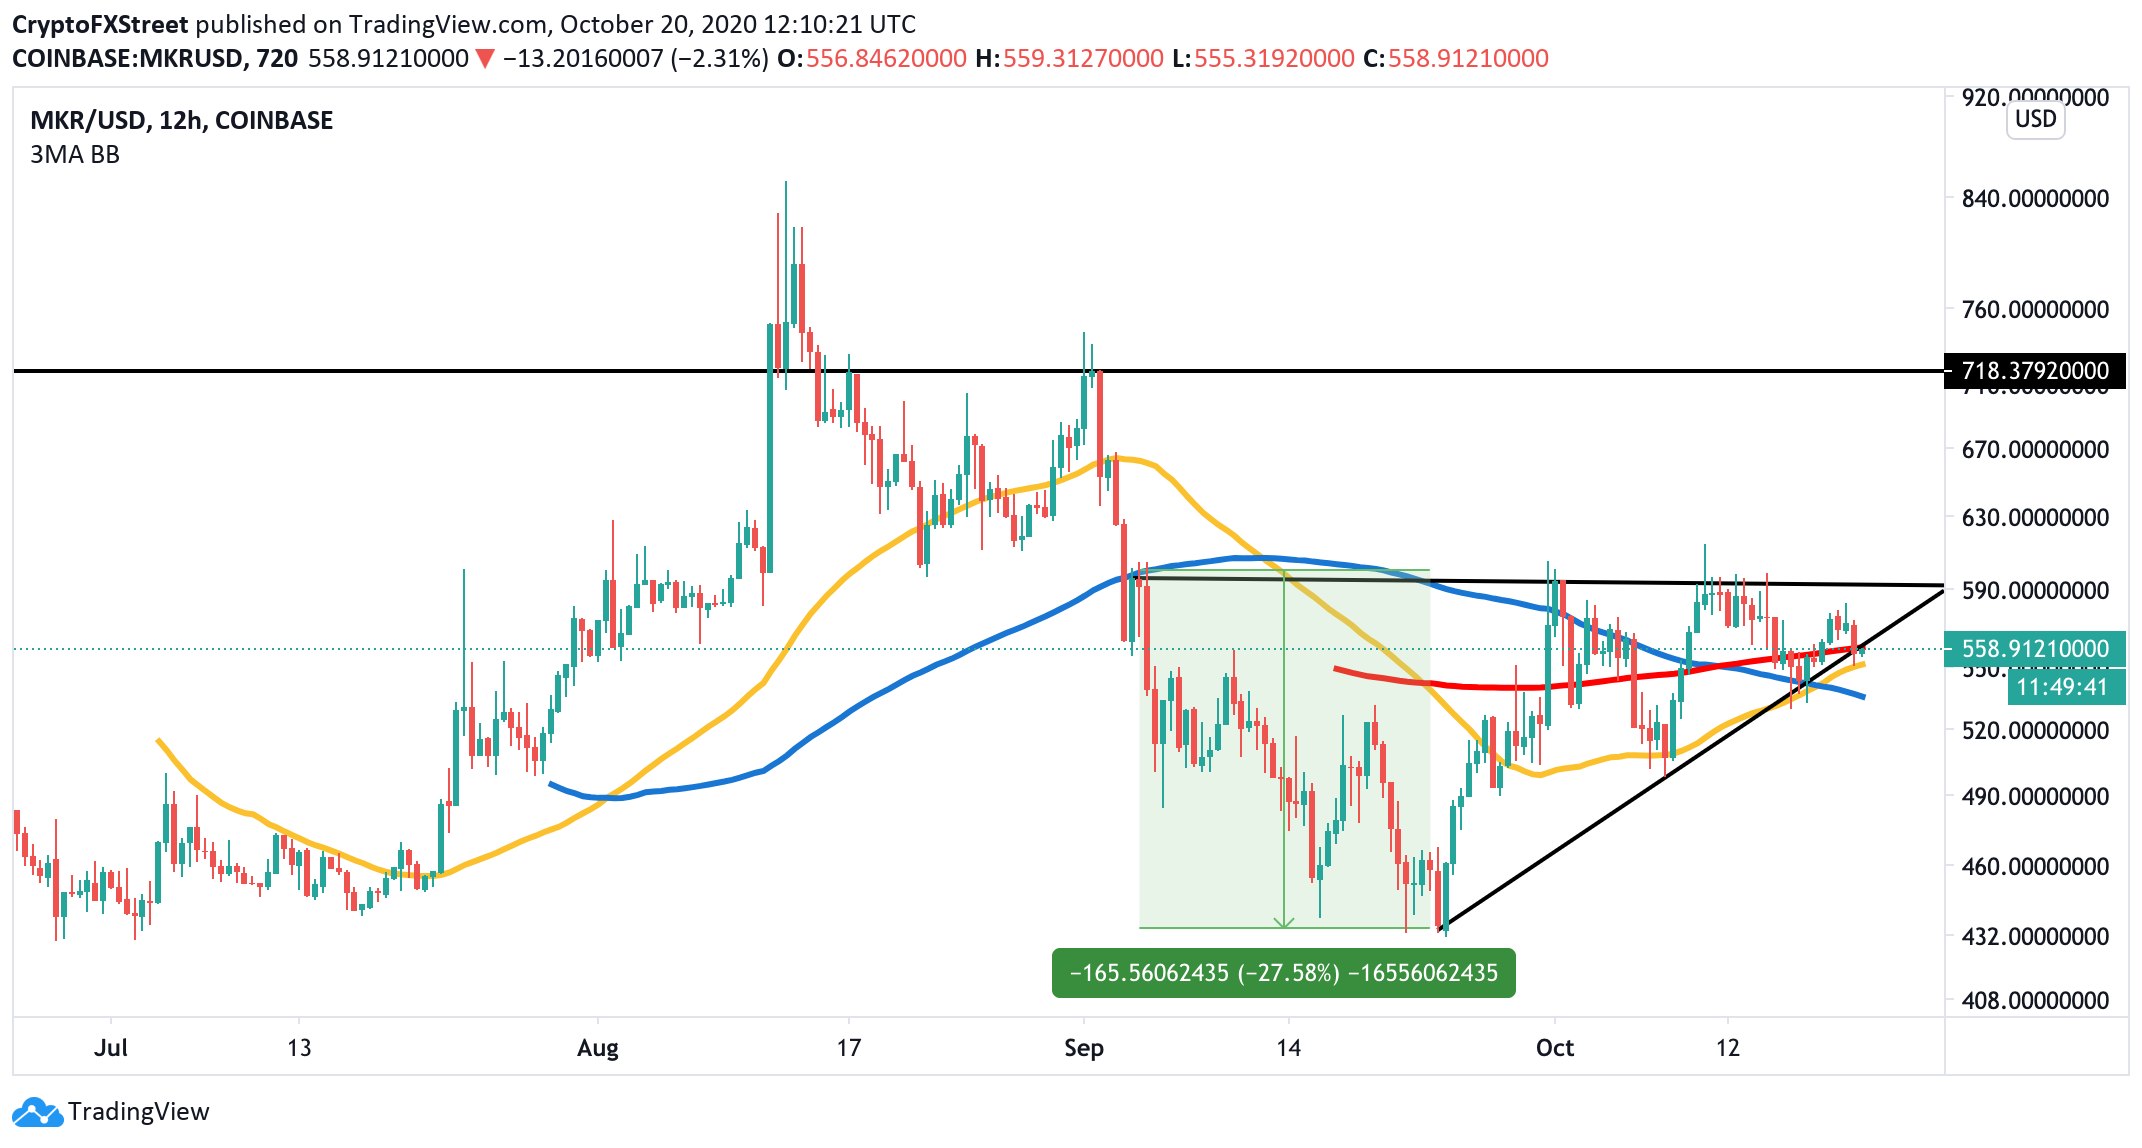
A failure to break below $555 will push the price inside the triangle and bring its upper line on the approach to $600 in focus. Once it is out of the way, the upside will likely gain traction with the next target at $700-$720. This area stopped the recovery at the end of August. A sustainable move above this area will open up the way to $852, which is the highest level in 2020.
MKR: IOMP data
 Analytics and Charts-637387932794608082.png)
Source: Intotheblock
The Intotheblock's data on in and out of the money positioning implies that the upside is the way of least resistance at this stage as there is little in terms of resistance going upwards. On the other hand, the sell-off may be limited by a cluster of 1,900 addresses holding 135,000 MKR. This barrier roughly coincides with the above-mentioned lower line of the triangle pattern and the EMAs on the 12-hour chart at $550.
However, even stronger support comes on approach to $500, with over 384,000 MKRs sitting in 1,600 addresses.
Key levels to watch
Summing up the above, MKR/USD is poised for recovery with the first aim at $600, followed by a stronger technical resistance of $700. The on-chain data adds credibility to the bullish forecast; however, the buyers should be cautious as the price is dangerously close to the triangle hypotenuse. A sustainable move below the $550-$540 area will invalidate the immediate bullish scenario and bring $500 into focus.
Author

Tanya Abrosimova
Independent Analyst


