Litecoin Technical Analysis: LTC/USD subject to potential fast moves deep south
- Litecoin price on Wednesday was very much vulnerable, down over 4% on the day.
- LTC/USD knocking on the door of vital near-term support area, breach is possible.
- Heavy downside pressure seen across the market, with several vital levels being tested.

LTC/USD 4-hour chart
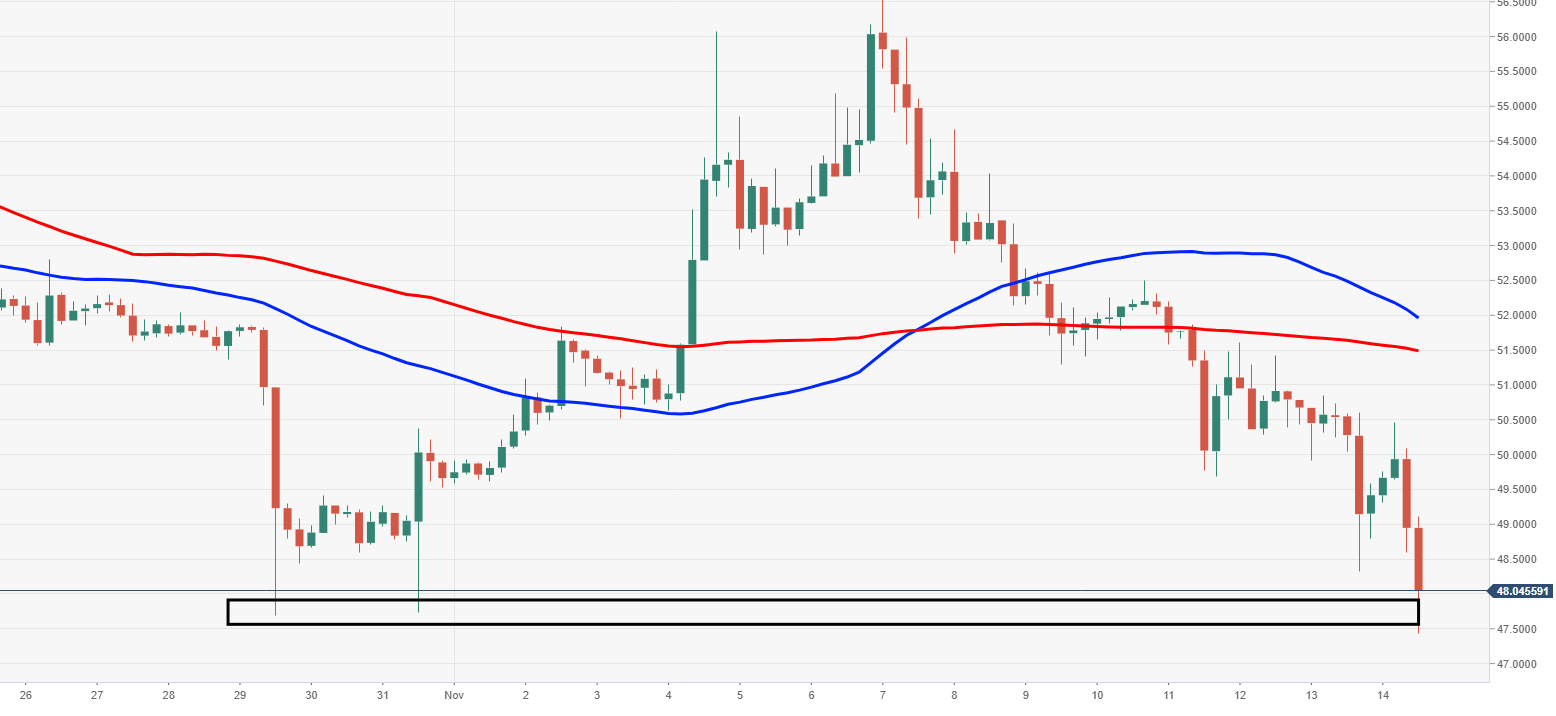
Spot rate: 47.79
Relative change: -3.70%
High: 50.84
Low: 47.43
Trend: Bearish
Support 1: 47.65, 29 October low & demand zone.
Support 2: 47.00, daily pivot point support.
Support 3: 45.69, daily pivot point support.
Resistance 1: 49.15, resistance on 4-hour.
Resistance 2: 50.73, daily pivot point resistance.
Resistance 3: 52.04, daily pivot point resistance.
LTC/USD 60-minute chart
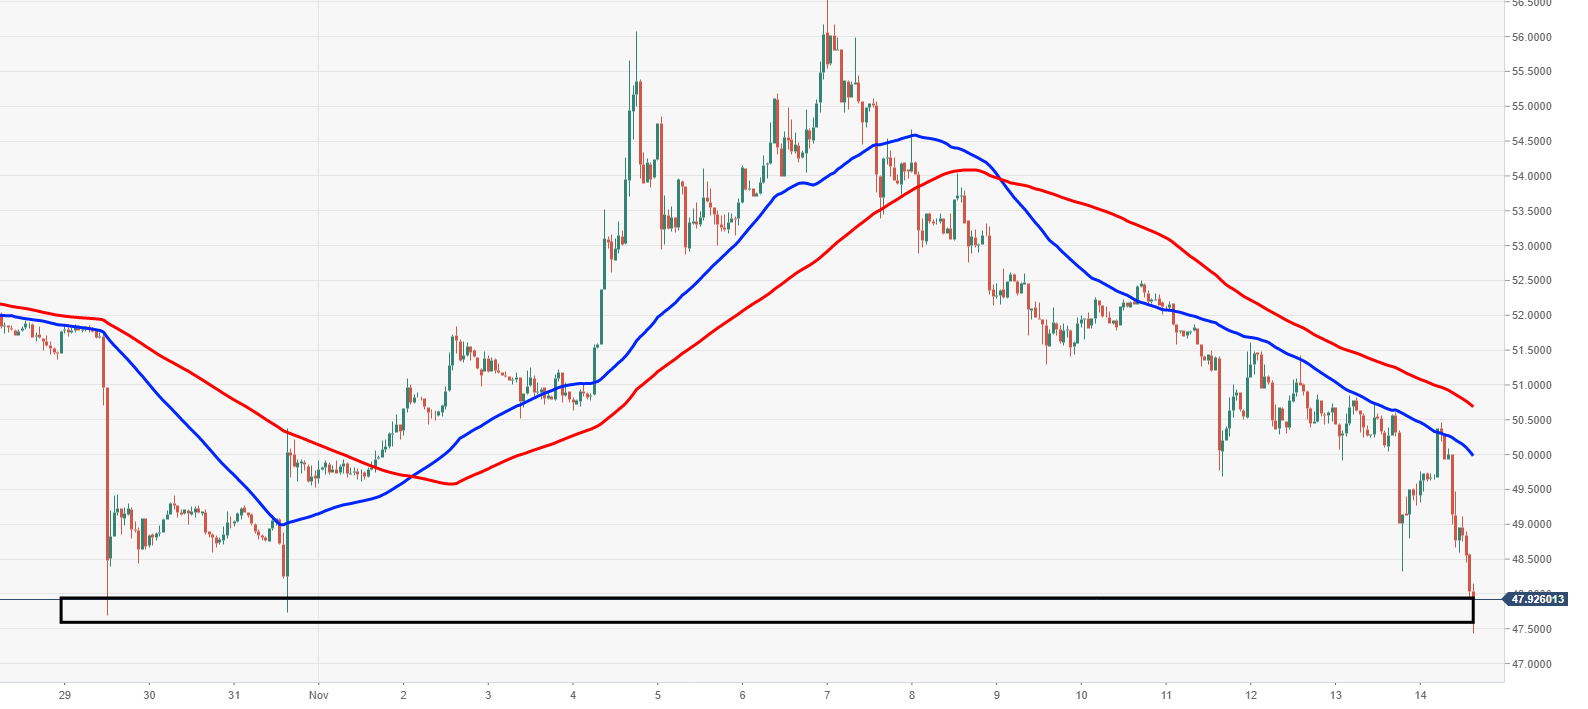
- Looking via the 60-minute, it can be seen how strong the buyes have proven to be in the past on 29th and 31st October, at current levels.
Author

Ken Chigbo
Independent Analyst
Ken has over 8 years exposure to the financial markets. He started his career as an analyst, covering a variety of asset classes; forex, fixed income, commodities and equities.


