Litecoin technical analysis: LTC/USD is trying to break back above ascending trend line
- Litecoin trading in the green with gains of 3.5% in the latter part of Friday.
- LTC/USD price action slipped below a critical ascending trend line of support, which is now acting as resistance.
- The price has managed to stabilize after the brutal selling on Thursday, which may not be done just yet.

Spot rate: 117.67
Relative change: +2.40%
High: 119.69
Low: 112.60
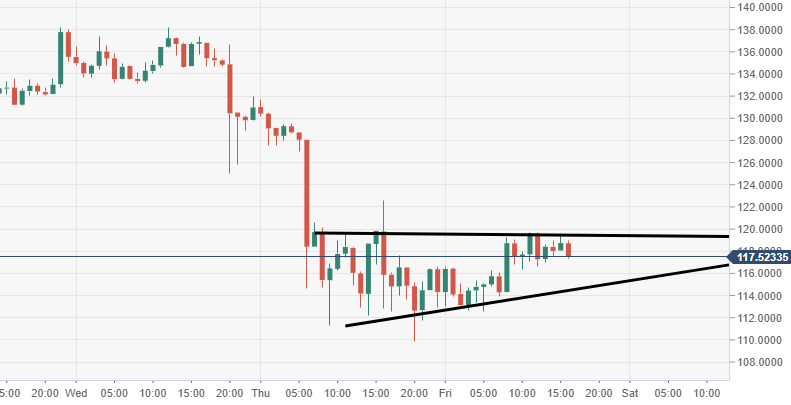
LTC/USD 60-minute chart
- A bearish pennant can be viewed via the 60-minute chart view for LTC/USD.
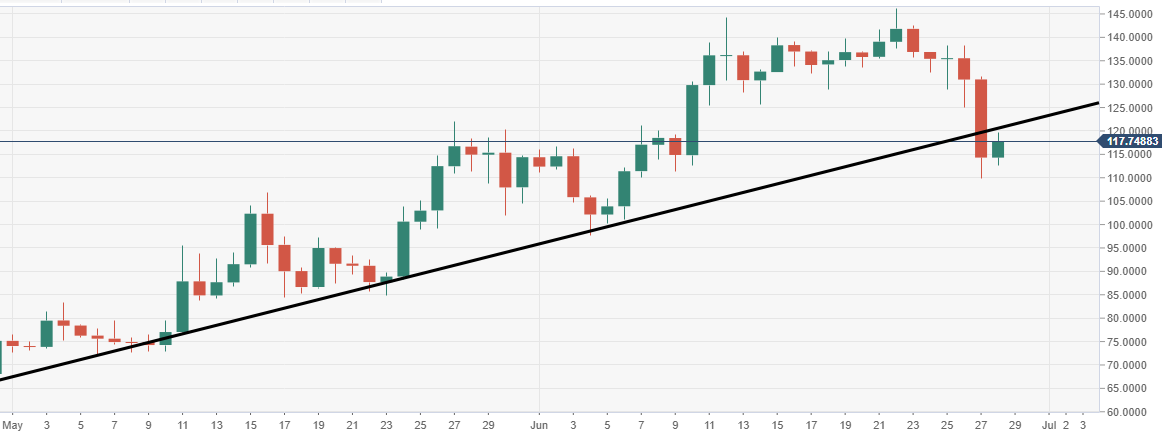
LTC/USD daily chart
- Bulls must force a daily closure back above breached ascending trend line of support, may prove to be tough as new resistance.
Author

Ken Chigbo
Independent Analyst
Ken has over 8 years exposure to the financial markets. He started his career as an analyst, covering a variety of asset classes; forex, fixed income, commodities and equities.
More from Ken Chigbo


