|

Litecoin Chart Analysis: LTC/USD maintains bullish tone but still needs to break $50.87

  • LTC is up 10% in the last 48 hours.
  • The current uptrend could be stopped by the resistance level at $50.87.
  • LTC/USD has experienced a significant surge in trading volume on most exchanges.

LTCUSD

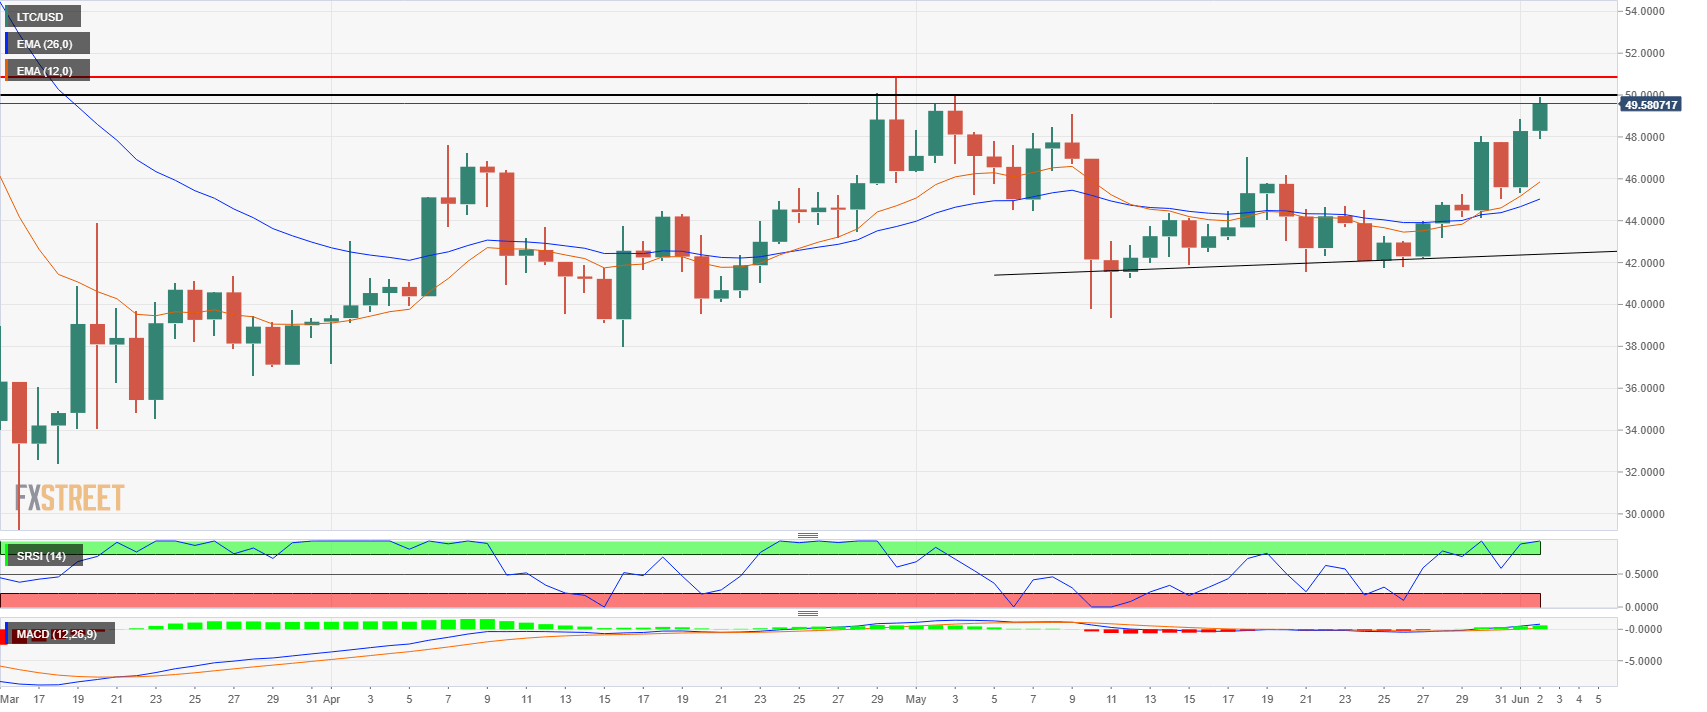
After a clear bull break on May 30, LTC/USD is now trading at around $49.58, inches away from the $50 resistance level, and the crucial $50.87 resistance point set on May 4. Bulls managed to break above the daily 12-EMA and the 26-EMA which also crossed bullishly.

Rejection of $50.87 can still hinder the current uptrend. So far, Litecoin has only been following the movement of Bitcoin and Ethereum, and it’s still at their mercy. A clear break above $50.87 can quickly push LTC up to $60. 

LTC/USD 4-hour chart

LTCUSD

Litecoin is inside a clear and robust 4-hour uptrend where bulls can look at all the higher lows as support levels. The nearest support level, however, is the 12-EMA currently set at $47.91, followed by the 26-EMA at $46.84. The RSI is overextended and will need to cool off eventually, but it won’t necessarily stop the bulls from breaking $50.

LTC/USD technical levels

LTC/USD

Overview
Today last price49.4997
Today Daily Change1.2193
Today Daily Change %2.53
Today daily open48.2804
 
Trends
Daily SMA2044.254
Daily SMA5044.2869
Daily SMA10045.6321
Daily SMA20049.9754
 
Levels
Previous Daily High48.8872
Previous Daily Low45.3553
Previous Weekly High45.3078
Previous Weekly Low41.7519
Previous Monthly High50.0012
Previous Monthly Low39.3673
Daily Fibonacci 38.2%47.538
Daily Fibonacci 61.8%46.7045
Daily Pivot Point S146.1281
Daily Pivot Point S243.9758
Daily Pivot Point S342.5963
Daily Pivot Point R149.66
Daily Pivot Point R251.0395
Daily Pivot Point R353.1918

Author

FXStreet Team

Composed of a group of economic journalists and FX experts, the FXStreet content team produces and oversees all content published on FXStreet. It provides a purely journalistic approach to the Forex market.


More from FXStreet Team
Share:

Editor's Picks

XRP turns bearish as US inflation jitters hit crypto

Ripple is stuck in a bearish trend, trading near $1.30 on Thursday. The remittance token’s bearish shift reflects the broader cryptocurrency market, which remains under heavy selling amid concerns about accelerating inflation in the US.

Pi Network extends losses ahead of Protocol v28 Mainnet upgrade

Pi Network (PI) trades around $0.0780 at press time on Thursday, rising from $0.0740 earlier in the day. Pi Mainnet is scheduled for the Protocol v28 upgrade on Friday, focusing on data handling and smart contract maintenance.

Crypto Today: Bitcoin, Ethereum and XRP test short-term support amid market-wide selling

Cryptocurrency prices remain under intense selling pressure on Thursday, with Bitcoin struggling to hold above $81,000 after testing its key demand area near $80,000. Ethereum reflects Bitcoin’s weakening technical outlook, edging lower below $2,400.

Bitcoin slips below $81,000 amid inflation fears, ETF outflows

Bitcoin extends losses, slipping below $81,000 on Thursday as hotter-than-expected US inflation data weigh on market sentiment. Institutional demand weakens as BTC spot ETFs recorded an outflow of over $261 million on Wednesday.

Bitcoin: Uptober or Rektober?
Bitcoin (BTC) price is down over 4% so far this week, trading below $83,000 at the time of writing on Friday as mounting selling pressure threatens to derail the seasonal “Uptober” rally. Profit-taking, a surge in long liquidations and weakening demand from institutional investors are weighing on BTC.