Litecoin and Hedera decline as ETF approvals await the US government shutdown to end
- Canary Capital filed S-1 amendments for Litecoin and Hedera spot ETFs, including fees and ticker codes.
- The ETFs are nearing approval, pending the end of the US government shutdown.
- Litecoin and Hedera remain under pressure as retail interest declines.

Canary Capital finalized the S-1 form adjustments for Litecoin (LTC) and Hedera (HBAR) spot Exchange Traded Funds (ETFs), a step closer to approval. Market analysts consider the US government shutdown a key hurdle that could delay the nod from the US Securities and Exchange Commission (SEC), while LTC and HBAR prices remain under pressure due to subsiding retail demand.
Analysts find the Litecoin and Hedera ETFs at the goal line
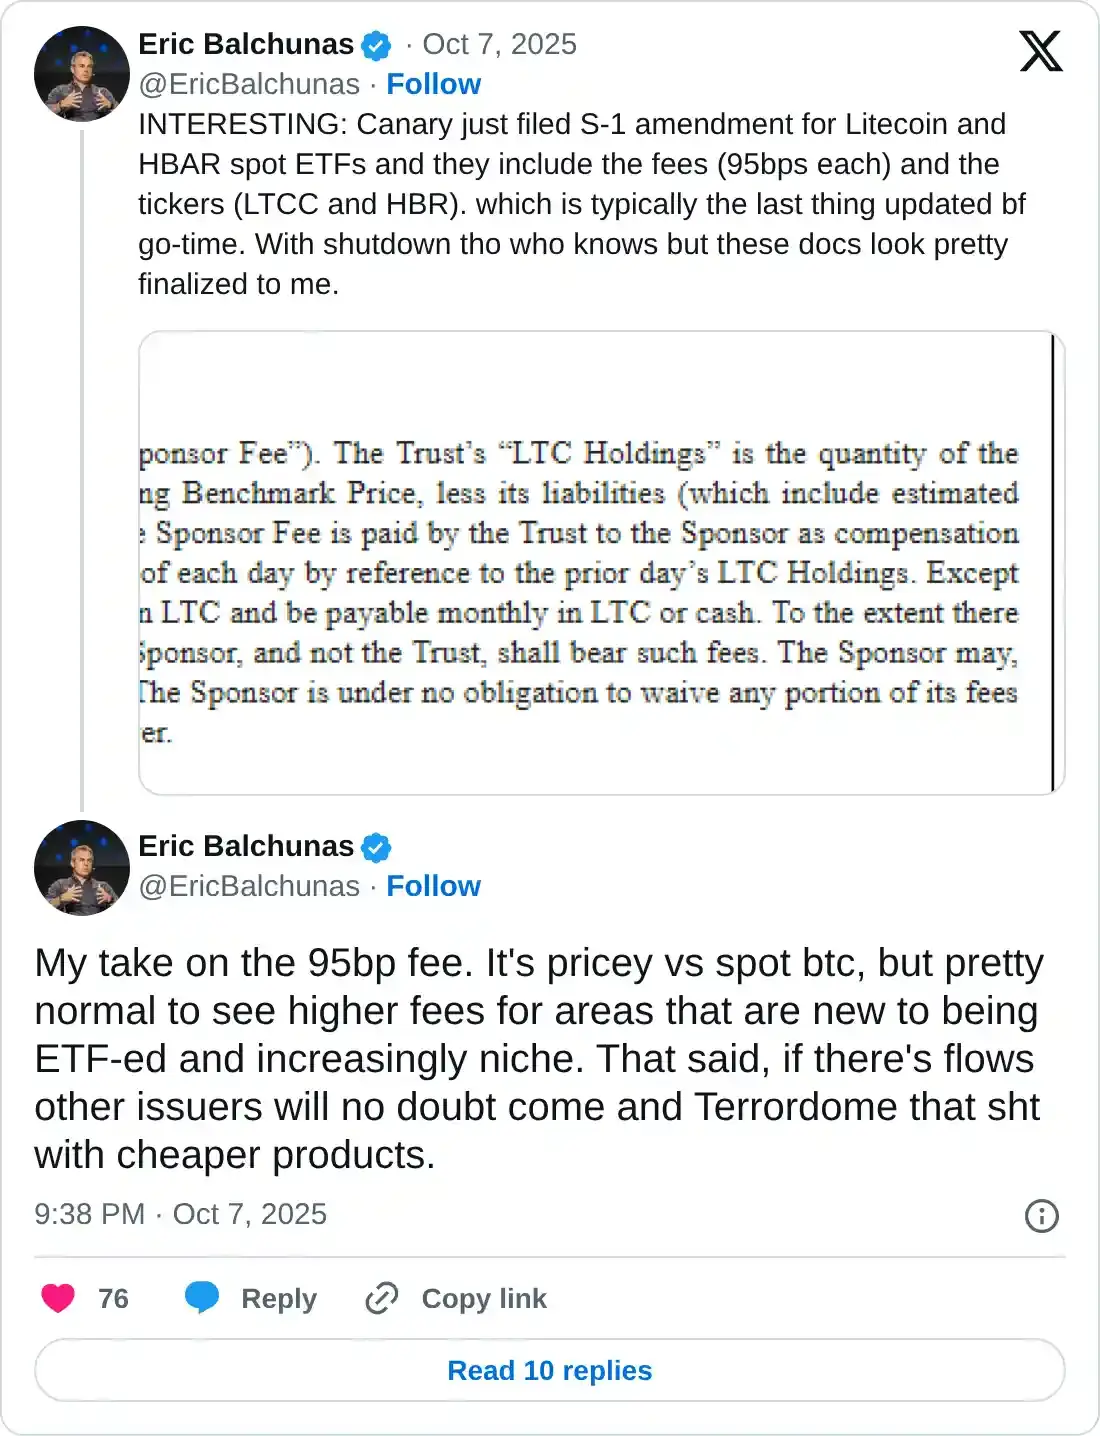
Eric Balchunas, the Bloomberg ETF analyst, shared in an X post on Tuesday that Canary Capital has submitted new S-1 amendments to its Litecoin and Hedera spot ETFs to the US SEC. These amendments include a 95 basis point fee, which is higher compared to Bitcoin ETFs, and a finalized ticker code of LTCC for Litecoin ETF and HBR for Hedera ETF.
According to Balchunas, these edits are typically made before the “go-time,” while the 95 bps fees could spawn new competitors with cheaper rates if the inflows gain traction for these niche products. The deadlines for the Canary Litecoin ETF and Canary HBAR ETF are October 15 and November 8, respectively.
However, the analyst also highlighted that the ongoing US government shutdown could delay the approvals despite the finalized documents. The federal government shutdown limits the SEC's functioning, as the Division of Corporation Finance (DCF) is unable to complete reviews or grant approvals, resulting in a temporary halt.
Supporting Balchunas, James Seyffart, another Bloomberg ETF analyst, mentioned that “Feels like Litecoin and HBAR ETFs are at the goal line here” in an X post on Tuesday.
Litecoin and Hedera stay on the edge
The retail interest in Litecoin and Hedera altcoins is declining as the broader cryptocurrency market experiences minor turbulence. CoinGlass data reveals that the LTC and HBAR Futures Open Interest (OI) have decreased by over 2% and 4%, respectively, within the last 24 hours. A decline in Futures OI indicates that traders are closing long positions, adopting a potential wait-and-see approach ahead of the ETF deadlines.
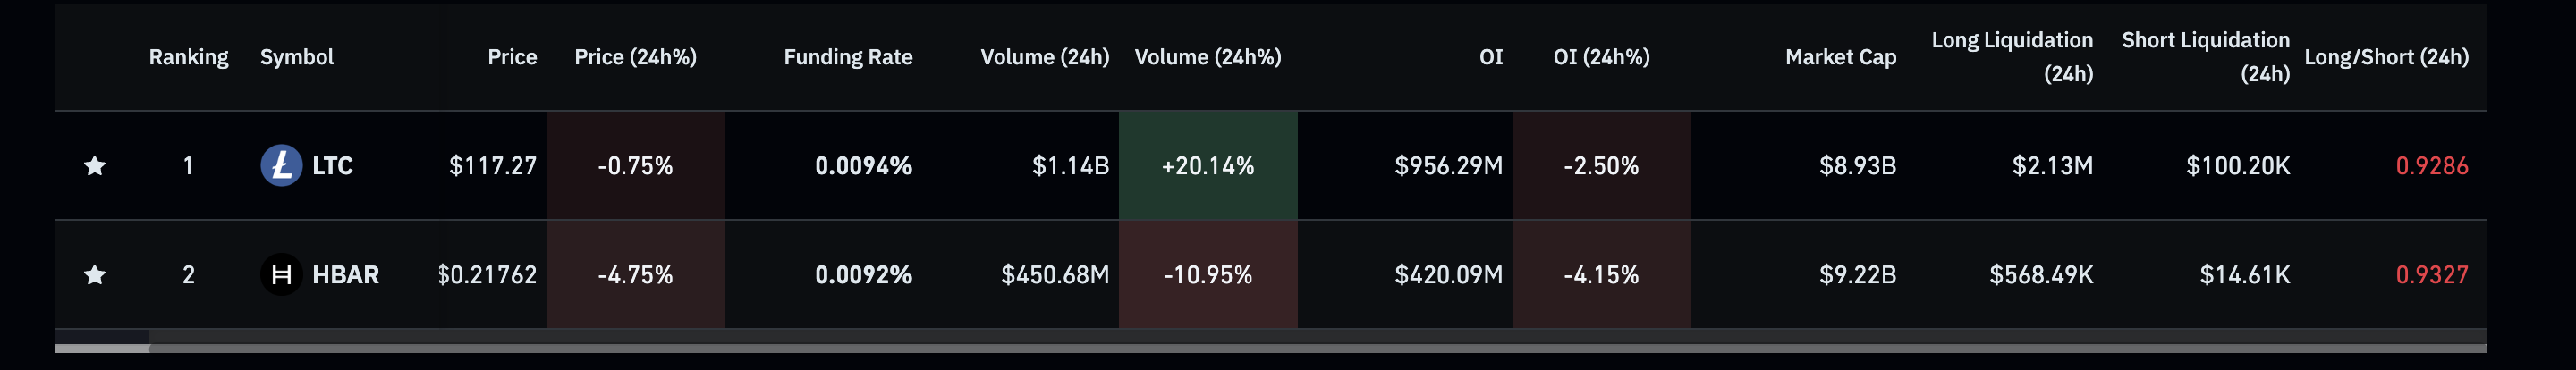
Litecoin and Hedera derivatives data. Source: CoinGlass
At the time of writing, Litecoin holds steady above $117, trading positively after three consecutive days of losses. This marks a short breather in the reversal from the 78.6% Fibonacci retracement level at $122, drawn from the $147 high of December 5 to the $63 low of April 7.
Standing as immediate support levels, the 50-day and 100-day Exponential Moving Averages (EMAs) at $112 and $109, respectively, could absorb the incoming supply.
The technical indicators on the daily chart suggest a minor decline in bullish momentum as the Relative Strength Index (RSI) slopes downward to 56, approaching neutral levels. Meanwhile, the Moving Average Convergence Divergence (MACD) inches closer to its signal line, risking a potential crossover, which would indicate a rise in selling pressure.
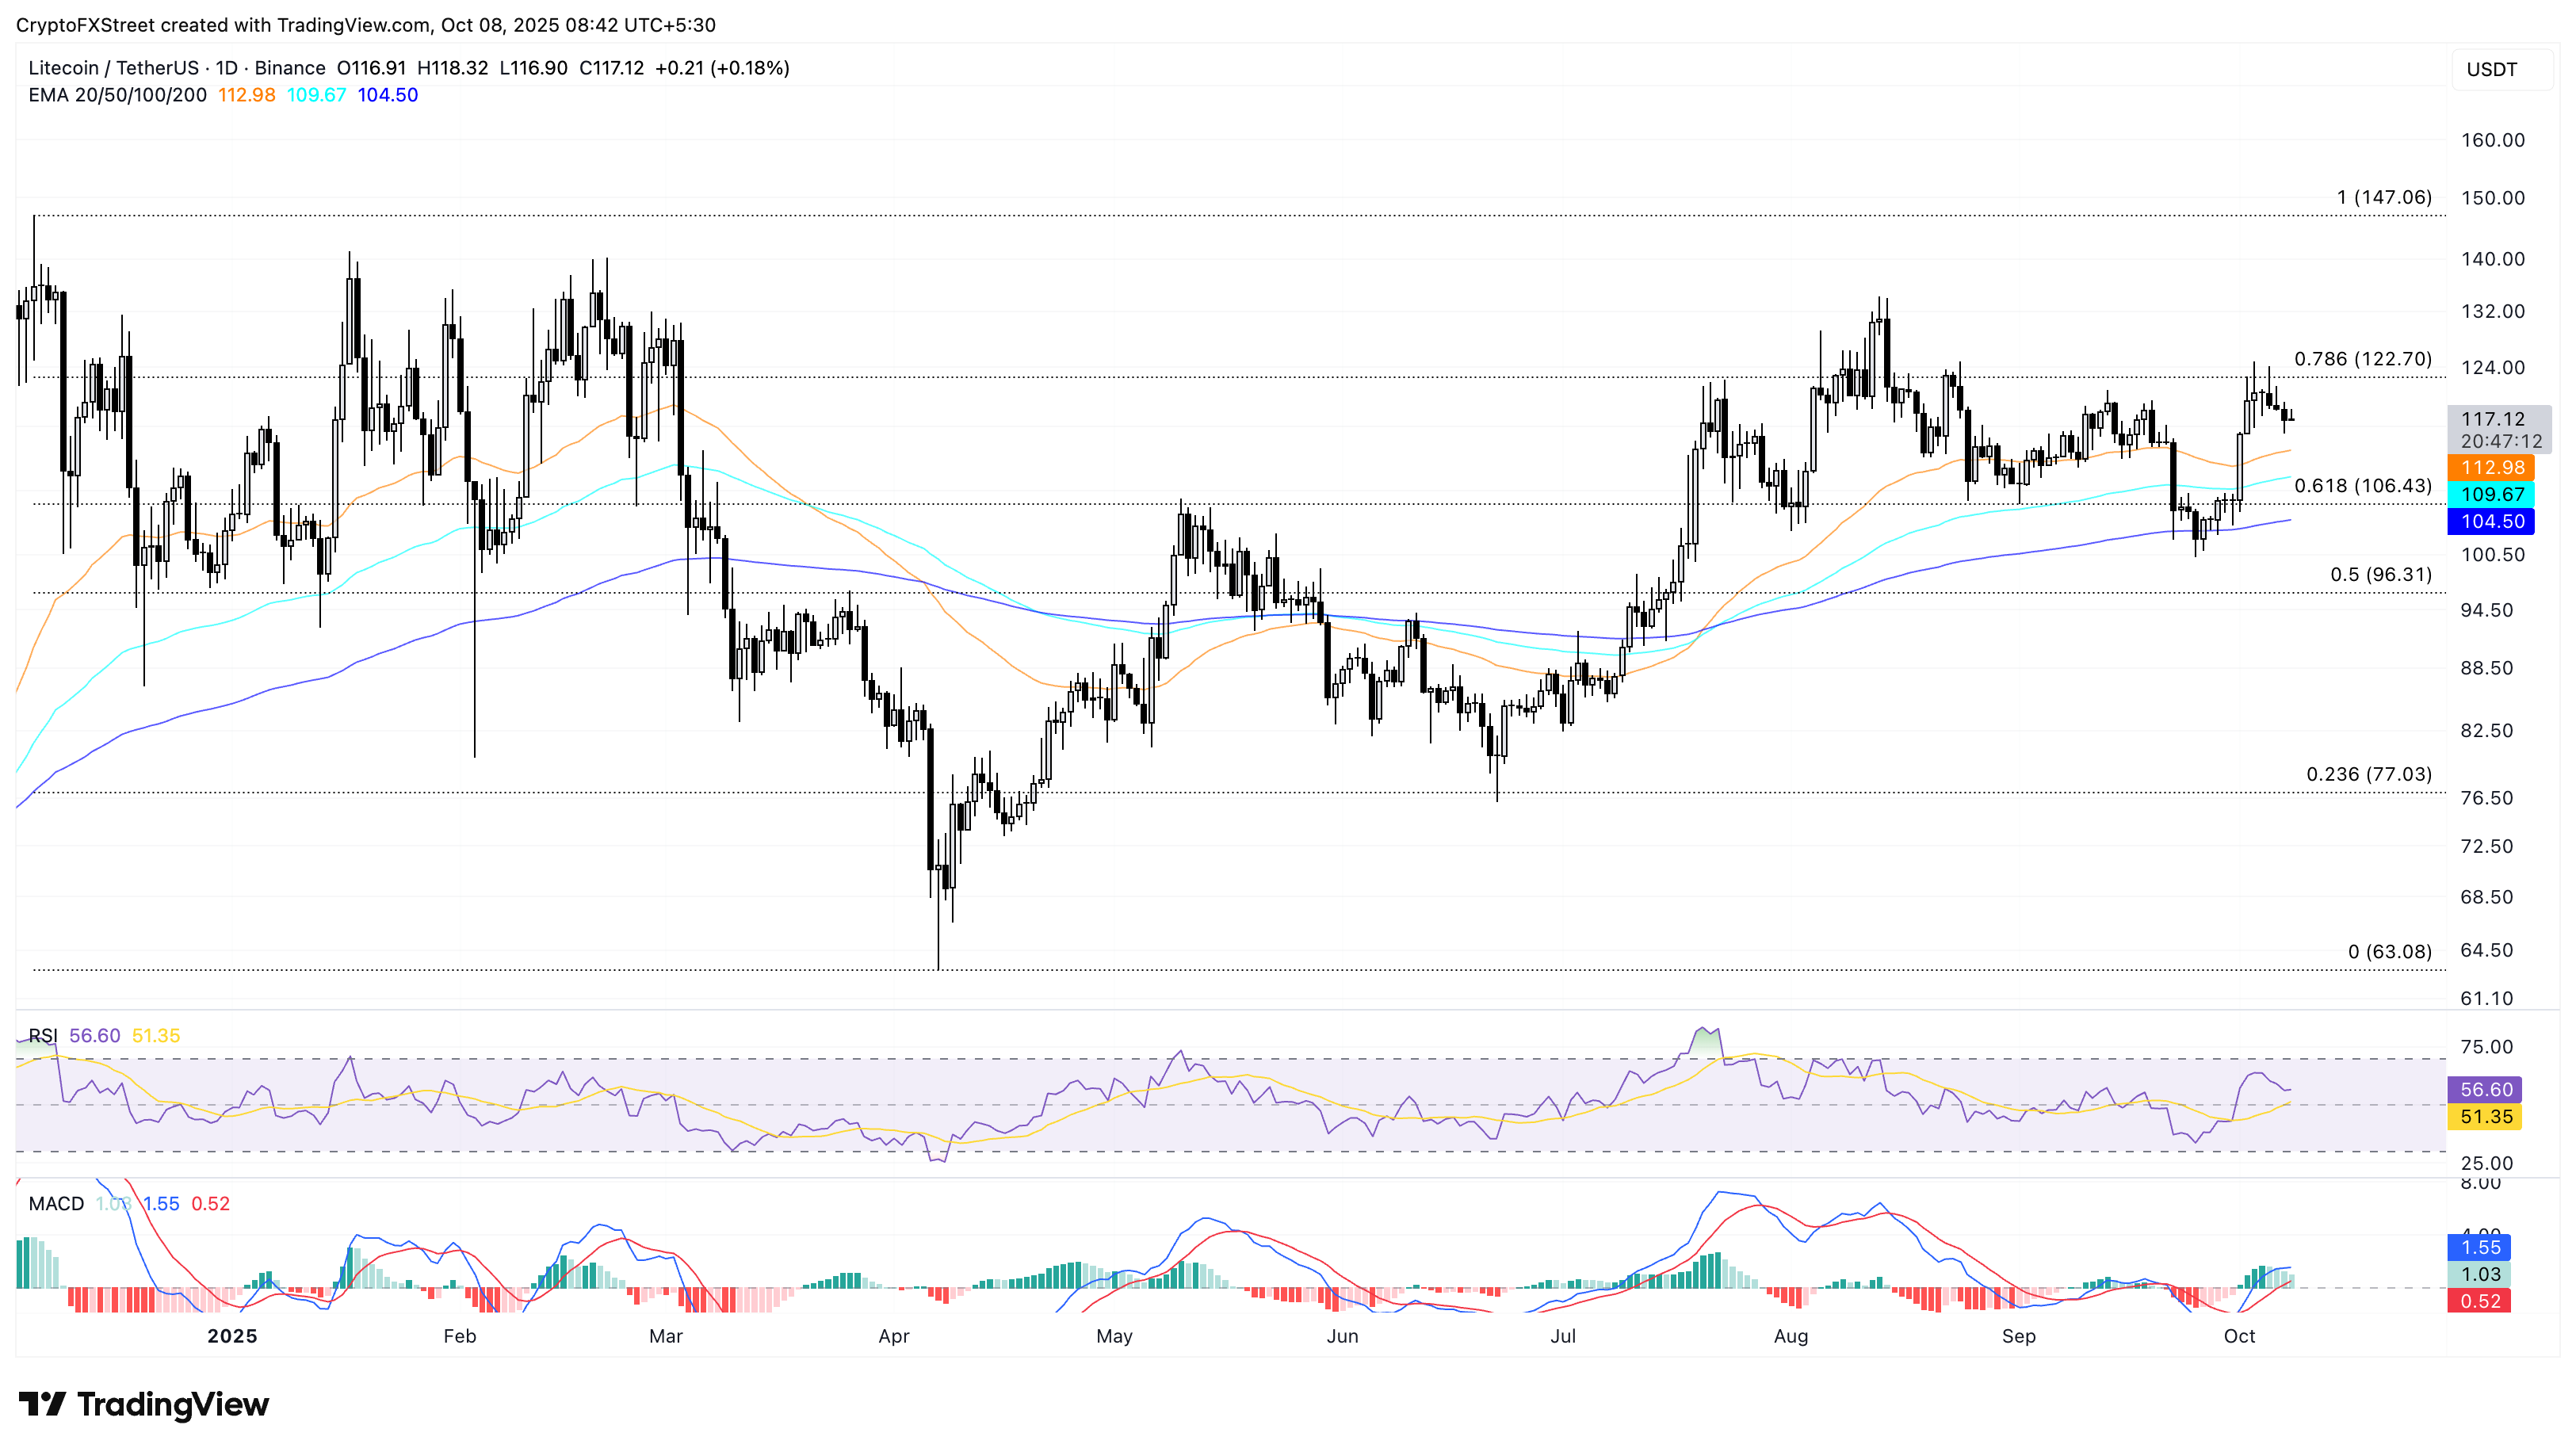
LTC/USDT daily price chart.
Looking up, if LTC exceeds $122, it could target the $147 peak as the primary target.
On the other hand, Hedera extends movement within a falling channel pattern on the daily chart, reversing from the overhead resistance trendline by 5% on Tuesday. At the time of writing, HBAR holds above the 200-day EMA at $0.2126 on Wednesday, struggling to avoid a further decline.
If HBAR drops below the 200-day EMA, the $0.2046 level, which provided a bounce back on September 26, or the support trendline at $0.1930 could act as support levels.
The RSI at 45 reverts below the halfway line as buying pressure fails to sustain itself at higher levels, suggesting overhead pressure. Additionally, the MACD and signal line are at a risk of a potential crossover, which could signal the start of a downtrend.
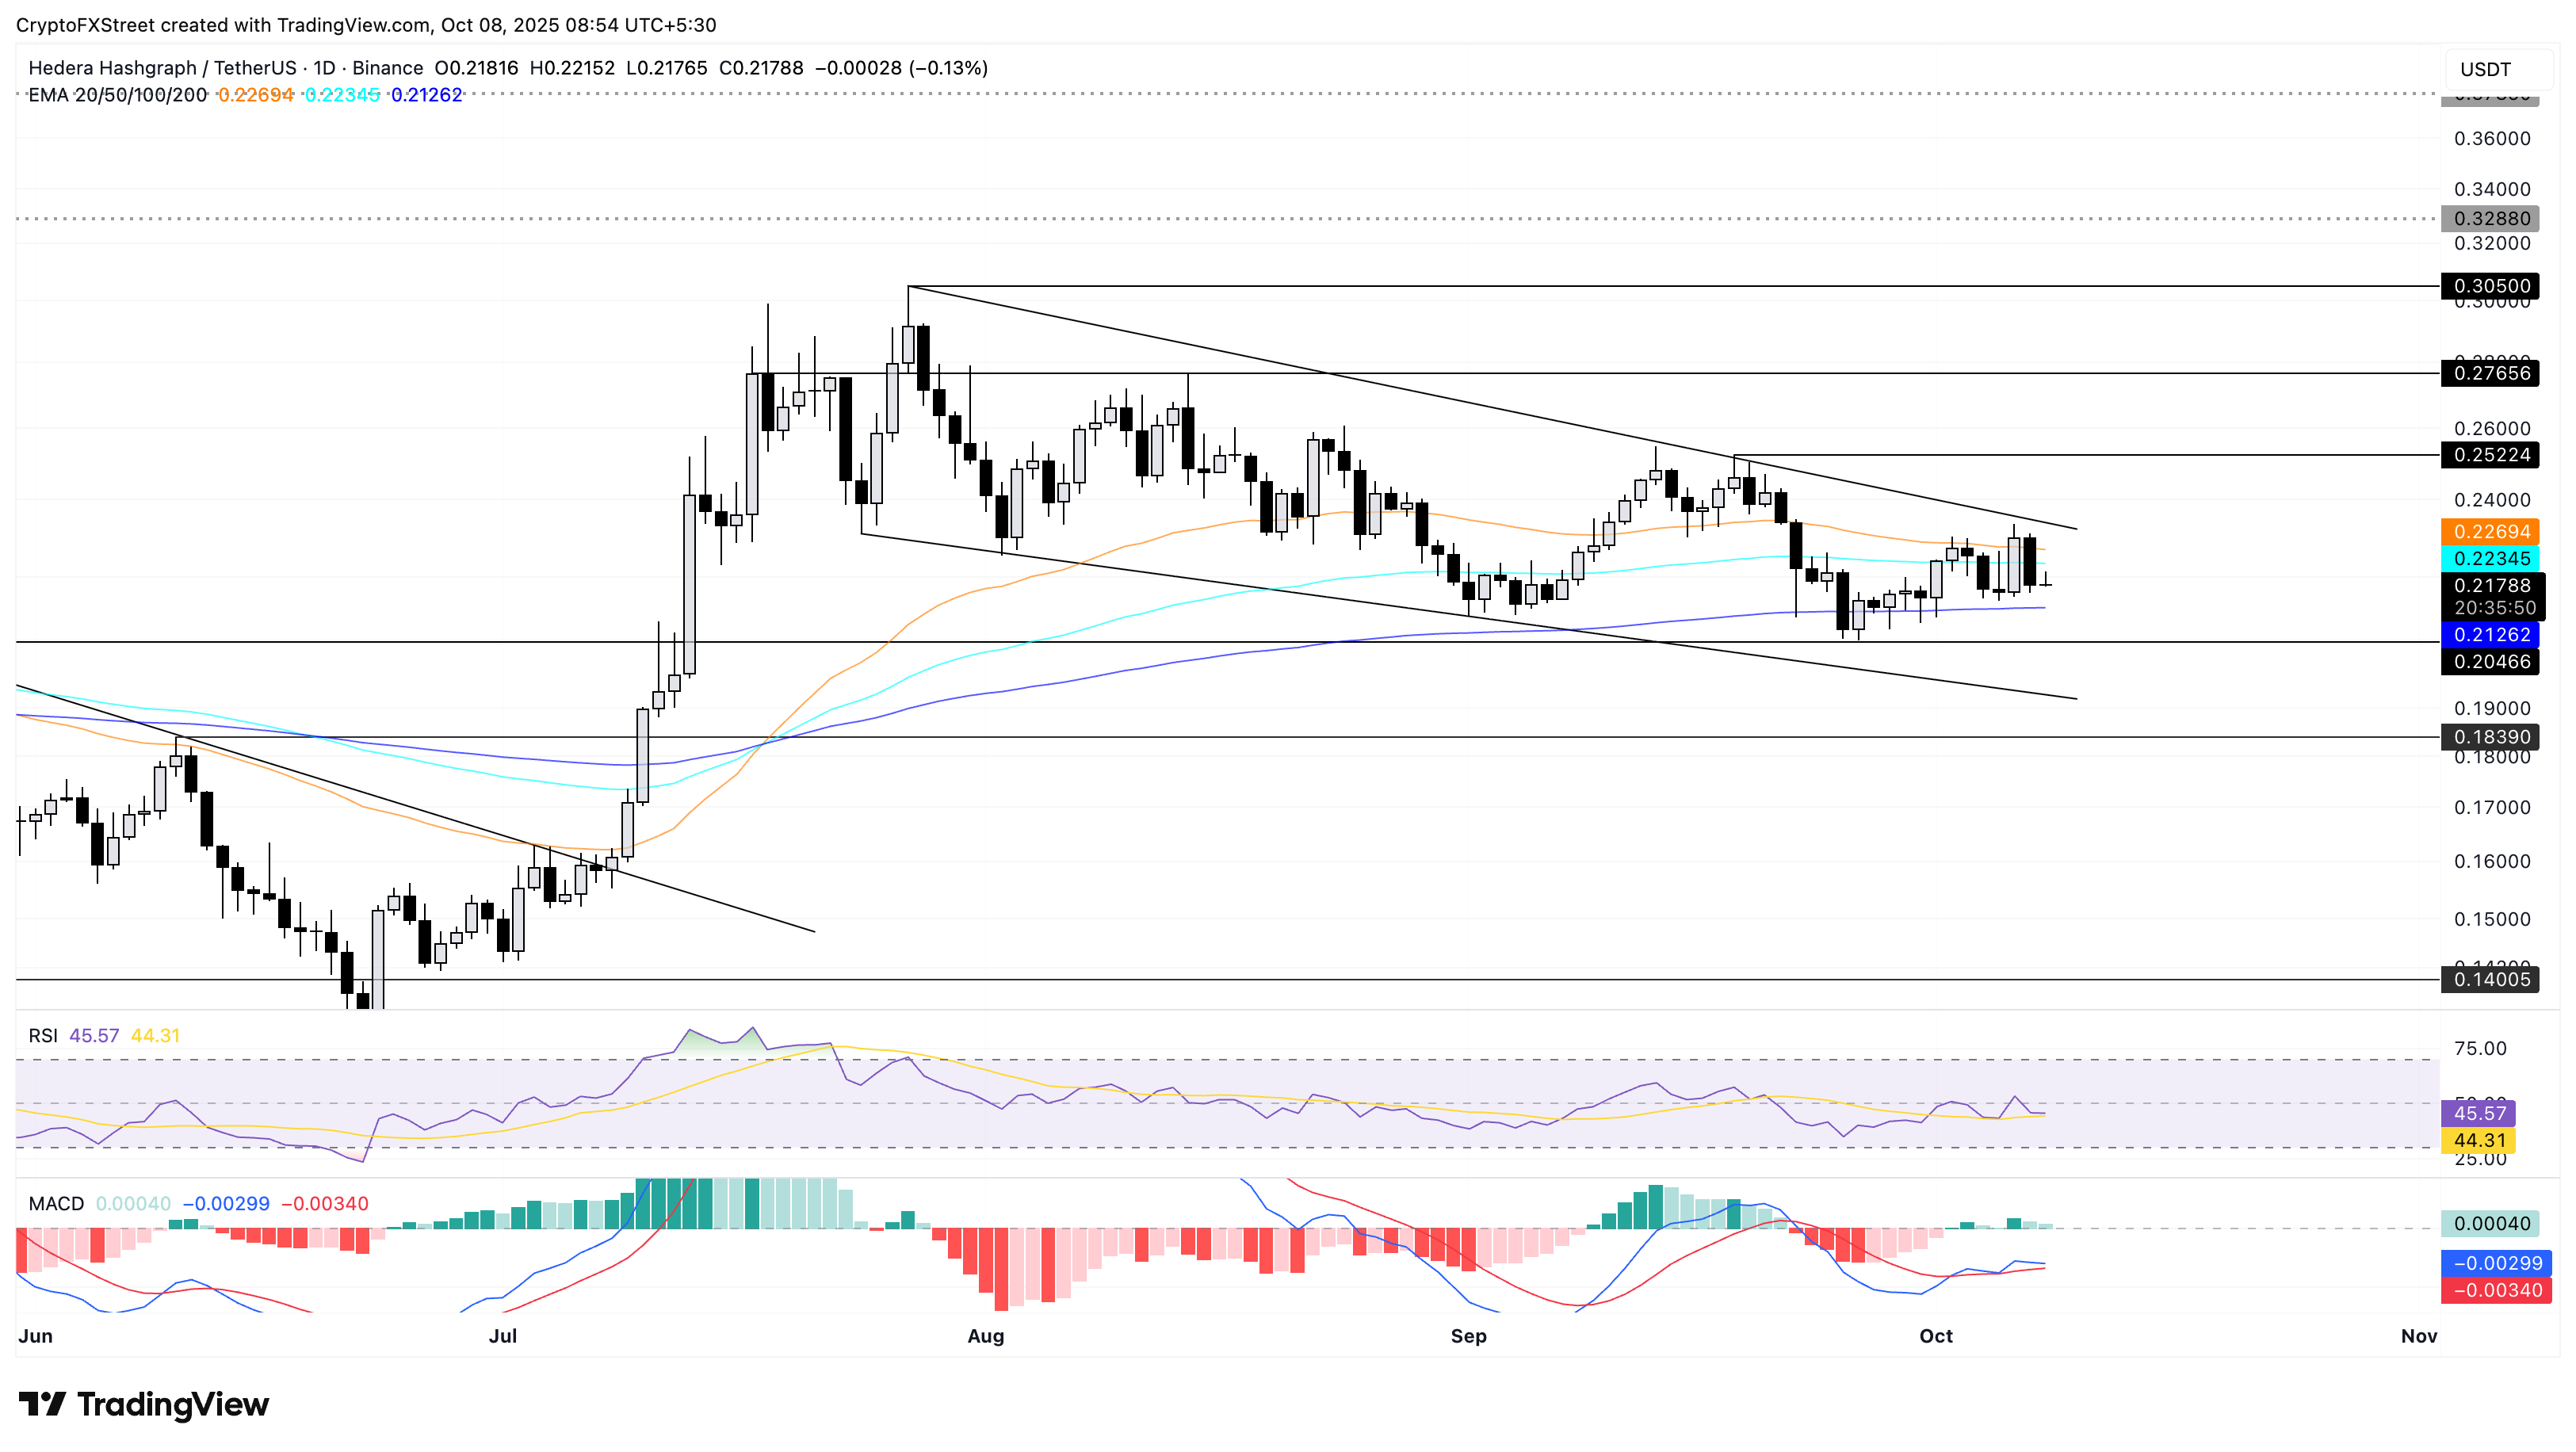
HBAR/USDT daily price chart.
On the upside, HBAR should surpass the overhead trendline at $0.2332, aligning with the high from Monday, which could confirm the falling channel breakout. The key resistance levels for the potential breakout rally are the $0.2522 and $0.2765 peaks from September 18 and August 14, respectively.
Author

Vishal Dixit
FXStreet
Vishal Dixit holds a B.Sc. in Chemistry from Wilson College but found his true calling in the world of crypto.


