IOTA Technical Analysis: IOTA/USD big bullish pennant eyed, just a matter of time for a breakout
- IOTA price suffered on Friday, losing further momentum after a good start to the trading week.
- IOTA/USD moving within a big bullish pennant pattern eyed on the daily chart.

IOTA/USD 4-hour chart
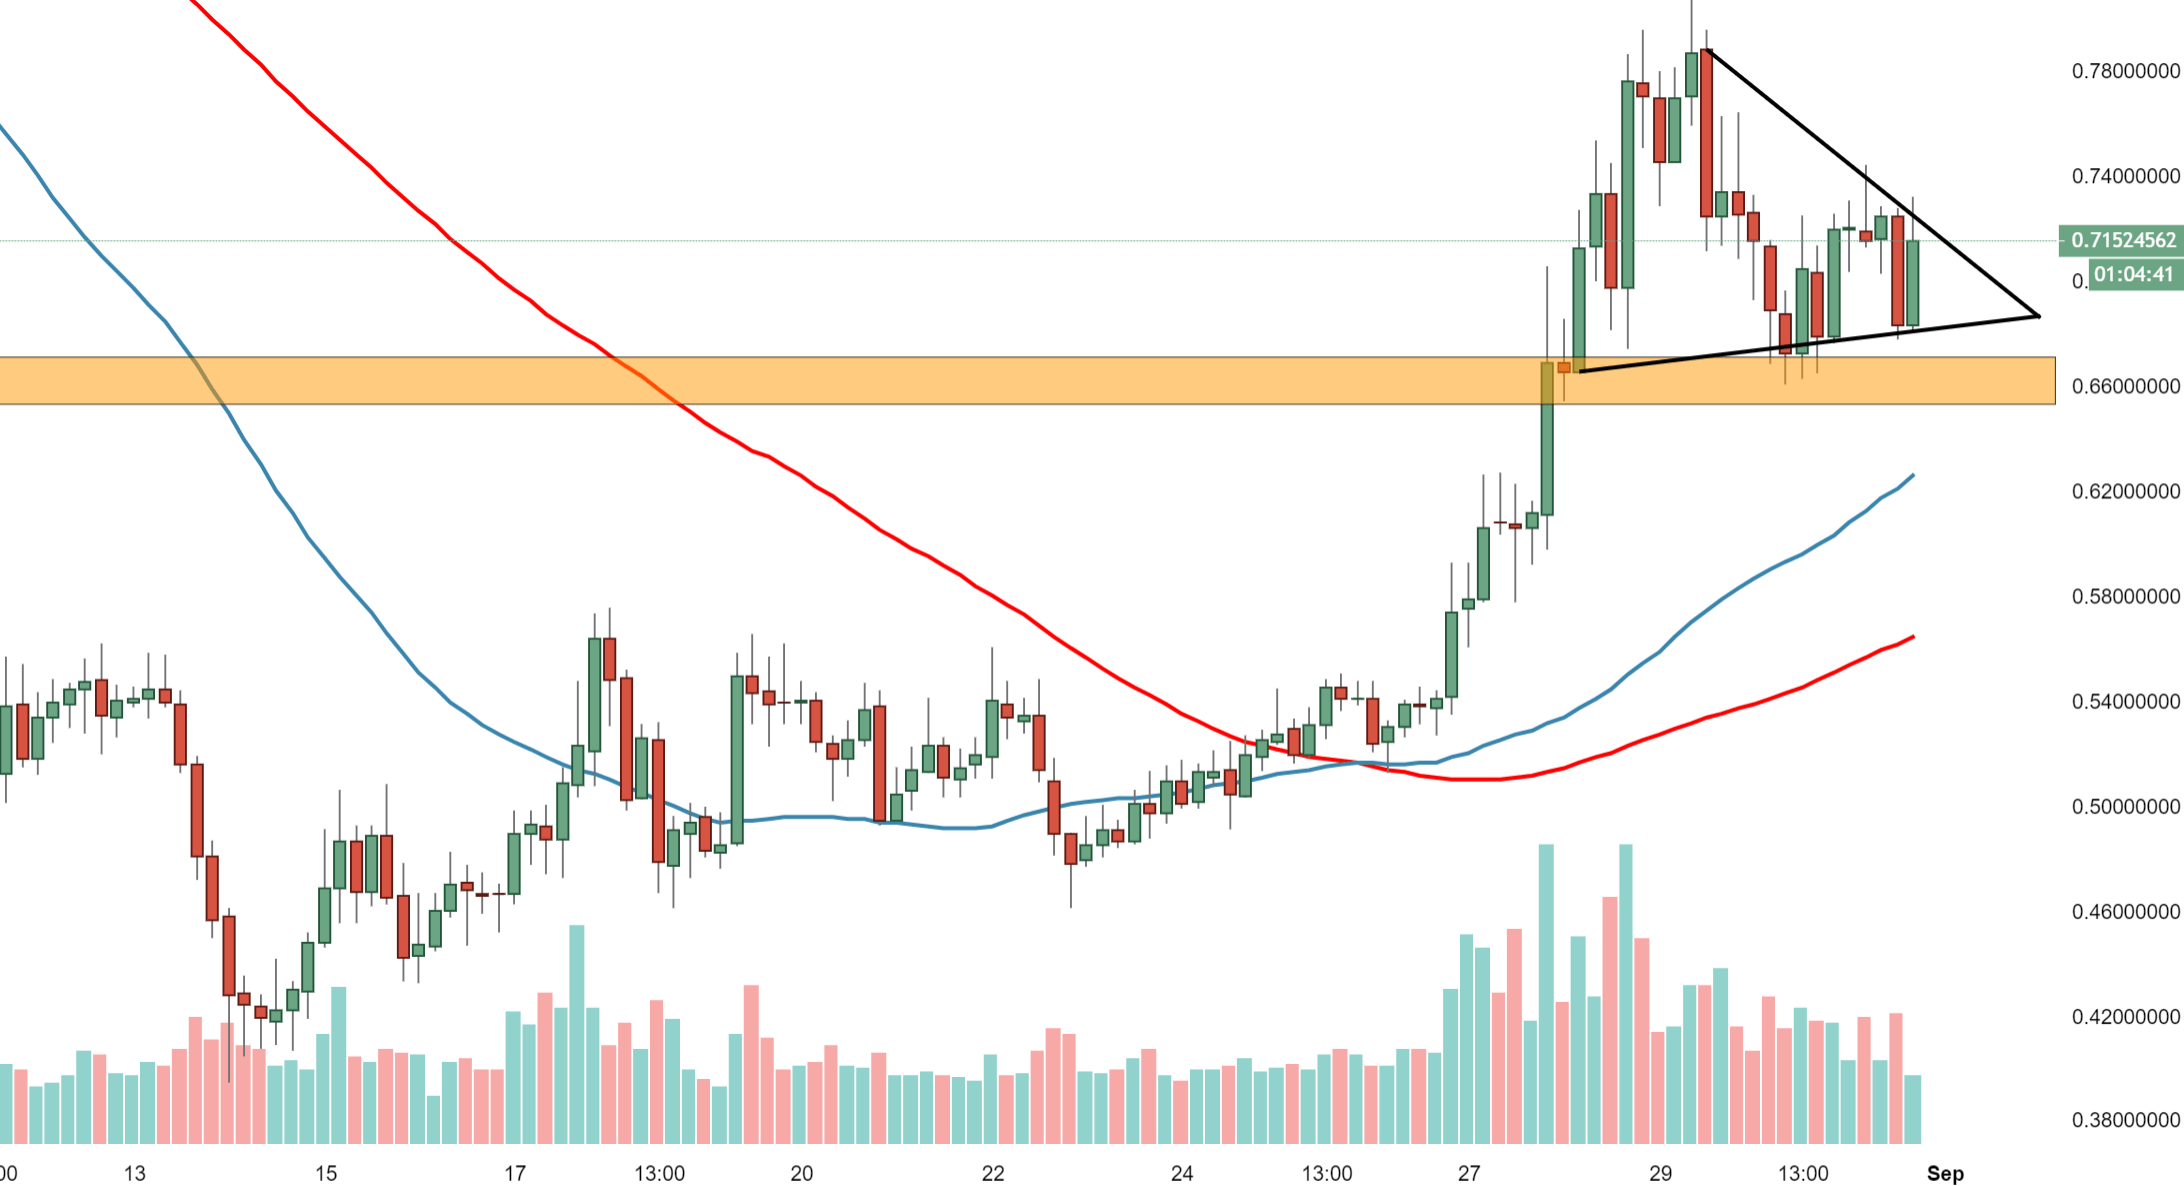
Spot rate: 0.7174
Relative change: -0.35%
High: 0.7518
Low: 0.6740
Trend: Bearish
Support 1: 0.6706-0.6520, chunky demand area.
Support 2: 0.6256, 50DMA & top area on 27th August.
Support 3: 0.5634, 100DMA.
Resistance 1: 0.7200. upper part of pennant pattern.
Resistance 2: 0.7430, resistance on 4-hour chart.
Resistance 3: 0.7945, top area 29th August & supply area.
Author

Ken Chigbo
Independent Analyst
Ken has over 8 years exposure to the financial markets. He started his career as an analyst, covering a variety of asset classes; forex, fixed income, commodities and equities.
More from Ken Chigbo


