|

IOTA Price Update: IOT/USD may struggle to stay above $0.2000

  • IOTA is one of the worst-perfroming coins, down 8% in the recent 24 hours.
  • The critical support is created by psychological $0.2000.

IOTA is the 23th largest digital asset with the current market value of $578 million and an average daily trading volume of $12 million. The coin has lost over 8% in the recent 24 hours and over 6% since the start of Monday to trade at $0.2077 at the time of writing. IOT/USD is moving within a short-term bearish trend in sync with the market.

IOT/USD: Technical picture

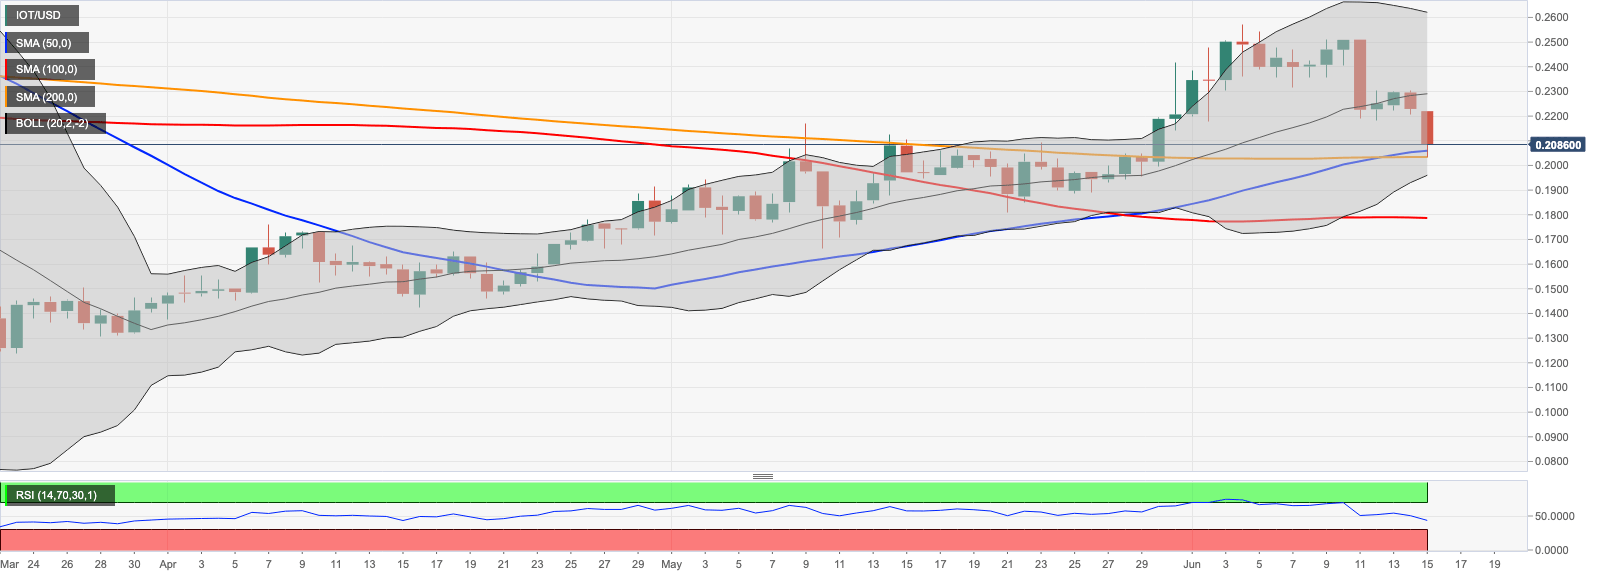
IOT/USD touched the intraday low at $0.2031 and rebounded above a cluster of daily SMA200 and SMA50 at $0.2050. Now this area serves as a local support for the price. Once it is out of the way, the sell-off is likely to gain traction with the next focus on psychological barrier of $0.2000, which is followed by the lower line of the daily Bollinger Band at $0.1958.

The downward-looking RSI on the daily chart implies that the bearish pressure is here to stay with the ultimate downside goal at $0.1800 reinforced by daily SMA100 at $0.1780.

On the upside,  we will need to see sustainable move above $0.2200-$0.2220 the upside to gain traction. This area contains the daily opening and a lower boundary of the weekend channel. If it is passed, the upside momentum may gather pace and take the price towards psychological $0.2300 with the middle line of the daily Bollinger Band located right below this barrier. 

IOT/USD daily chart
The RSI on an intraday chart attempts a recovery out of the oversold territory; however, there are no clear signals of reversal as yet. The above-mentioned resistance area of $0.2000-$0.2200 is confirmed by 1-hour SMA50 and followed by SMA100 at $0.2260. The upper boundary of the short-term consolidation channel and the upper line of the 1-hour Bollinger Band adds strength to $0.2300.

IOT/USD 1-hour chart

Author

Tanya Abrosimova

Tanya Abrosimova

Independent Analyst


More from Tanya Abrosimova
Share:

Editor's Picks

Bitcoin Weekly Forecast: BTC retreats as macro headwinds grow
Bitcoin (BTC) remains under pressure, down over 4% this week and trading around $76,900 at the time of writing on Friday. Institutional demand shows signs of weakness as spot BTC Exchange Traded Funds (ETFs) are on track to end their three-week inflow streak, recording nearly $500 million in net outflows through Thursday.
XRP falls toward key support as macro uncertainty, weak momentum cap recovery
Ripple (XRP) falls below $1.33 on Friday, marking the third consecutive day of declines. The token continues to track the broader cryptocurrency market downturn, with investors closely monitoring heightened macroeconomic uncertainty ahead of the United States (US) Consumer Price Index (CPI) release and next week’s Federal Reserve (Fed) monetary policy decision.
Crypto Today: Bitcoin, Ethereum, XRP stabilize at lower levels amid ETF outflows and macroeconomic risks
The broader cryptocurrency market is rising on Friday, with Bitcoin (BTC) trading above $77,000 after testing lower support near $76,500. Ethereum (ETH) shows signs of stability, hovering above the support provided at $2,400 despite capped upside at $2,500. Meanwhile, Ripple (XRP) holds above $1.33 after three straight days of declines, reflecting growing headwinds due to macroeconomic uncertainty.
Bitcoin pulls back as another golden cross fails to deliver
Earlier this week, Bitcoin formed a golden cross, a technical signal that occurs when the price’s 50-day moving average rises above the 200-day moving average and is conventionally viewed as a precursor to a bullish rally. Historically, however, that’s often not been the case.
Bitcoin: BTC retreats as macro headwinds grow
Bitcoin (BTC) remains under pressure, down over 4% this week and trading around $76,900 at the time of writing on Friday. Institutional demand shows signs of weakness as spot BTC Exchange Traded Funds (ETFs) are on track to end their three-week inflow streak, recording nearly $500 million in net outflows through Thursday.


