Hyperliquid Price Forecast: HYPE eyes record highs as bullish momentum and on-chain activity accelerate
- Hyperliquid price extends gains, trading above $48.50 on Monday after surging over 26% last week,
- On-chain data paints a bullish picture with rising open interest, increased whale activity, and 24-hour chain fees surpassing both edgeX and BNB Chain.
- The technical outlook suggests a rally toward the record highs as bullish momentum builds.

Hyperliquid (HYPE) continues to extend its gains, trading above $48.50 at the time of writing on Monday, having rallied over 26% in the previous week. On-chain data suggest further gains, with rising open interest, increased whale activity, and 24-hour chain fees surpassing major networks such as edgeX and BNB Chain. The technical analysis suggests HYPE could retest or even surpass its record highs in the coming days.
Hyperliquid’s derivatives and on-chain data show bullish bias
Futures’ Open Interest (OI) in Hyperliquid at exchanges rose from $1.27 billion on Wednesday to $1.97 billion on Monday, the highest level since October 11 and has been consistently rising. Rising OI represents new or additional money entering the market and new buying, which could fuel the current HYPE price rally.
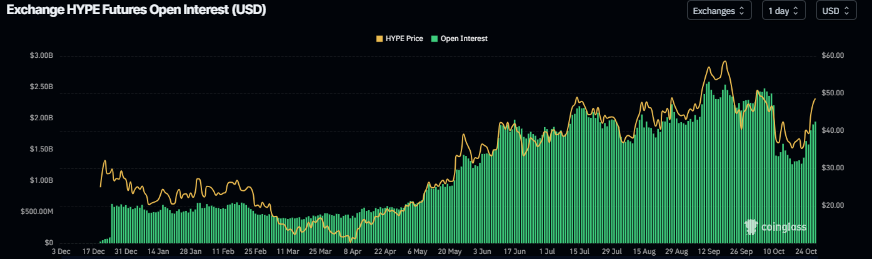
HYPE open interest chart. Source: Coinglass
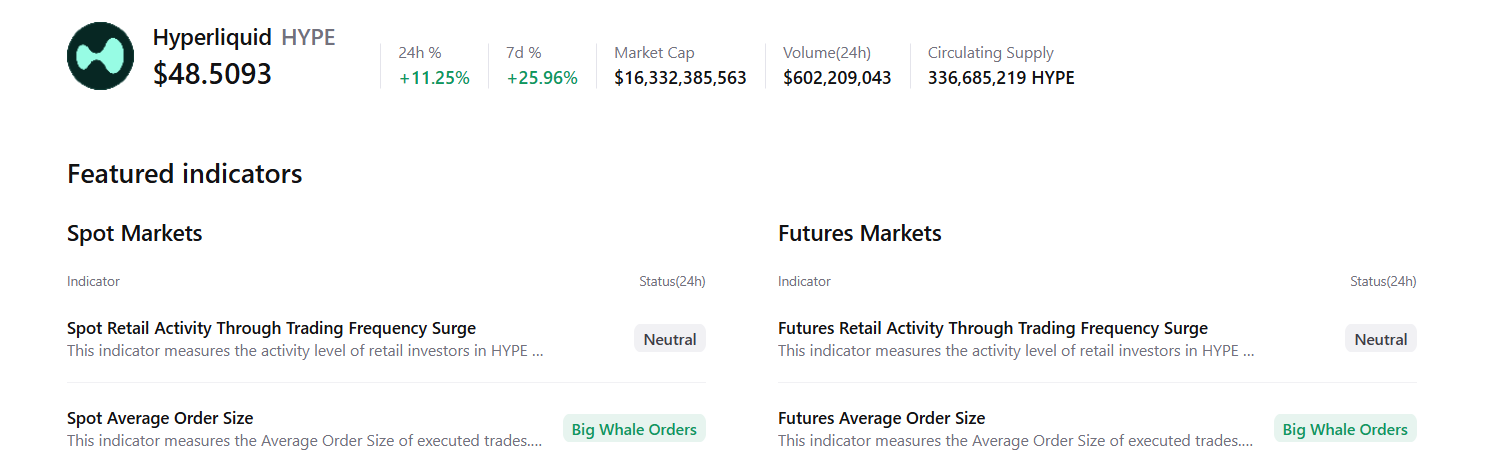
CryptoQuant’s summary data supports the bullish outlook, as HYPE’s spot and futures markets show large whale orders and buy dominance, signaling a potential rally ahead.
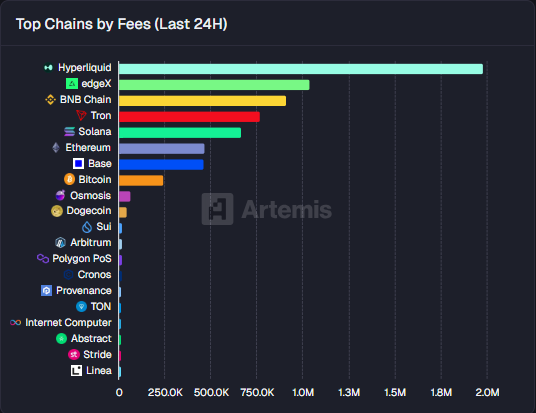
According to Artemis Terminal data, Hyperliquid’s 24-hour chain fee collection is $2 million, topping the list of other networks such as edgeX and BNB Chain, indicating growing interest among traders and liquidity on the HYPE chain.
Hyperliquid Price Forecast: HYPE bulls aiming for record highs
Hyperliquid price broke above the descending trendline (drawn by connecting multiple lows since September 18) on Saturday and closed above the 50-day Exponential Moving Average (EMA) at $43.54. On Sunday, HYPE found support around the 50-day EMA and rose nearly 7% that day. At the time of writing on Monday, HYPE continues its gains, trading above $48.57.
If HYPE continues its upward trend and closes above the daily resistance at $51.15, it could extend the rally toward the record high of $59.46, reached on September 18.
The Relative Strength Index (RSI) on the daily chart reads 61, above the neutral level of 50, indicating bullish momentum gaining traction. Additionally, the Moving Average Convergence Divergence (MACD) showed a bullish crossover last week, providing a buy signal and further supporting the bullish view.
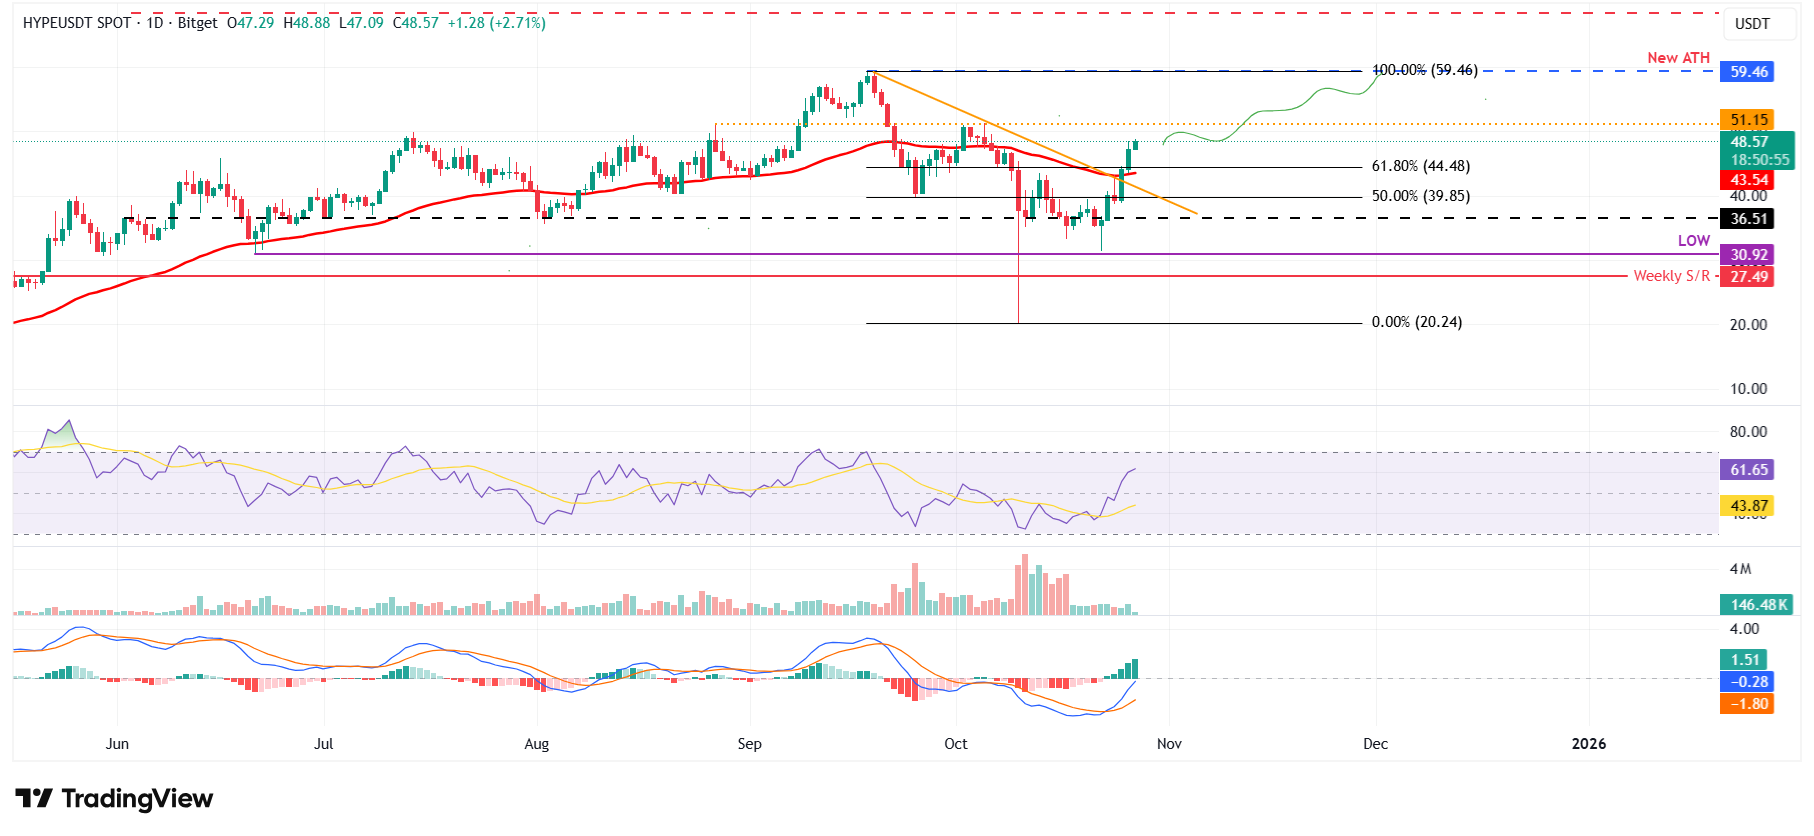
HYPE/USDT daily chart
On the other hand, if HYPE faces a correction, it could extend the decline toward the 50-day EMA at $43.54.
Author

Manish Chhetri
FXStreet
Manish Chhetri is a crypto specialist with over four years of experience in the cryptocurrency industry.



