Hyperliquid Price Forecast: HYPE eyes a rebound as selling pressure wanes
- Hyperliquid’s token recovery extends for the third consecutive day, nearing the $40 mark.
- The retail interest in the HYPE token resurfaces, corroborating a bullish reversal thesis.
- The Decentralized Exchange statistics show a decline in Open Interest and inflows, suggesting that traders' demand is low.

Hyperliquid (HYPE) retraces back higher to the 200-day Exponential Moving Average (EMA), a key trend indicator, following three consecutive days of recovery. At the time of writing, HYPE edges higher by 3% on Monday, while the technical outlook and derivatives data suggest a decline in selling pressure.
Still, a drop in the perpetual Decentralized Exchange (DEX) activities indicates a lack of traders’ demand necessary to boost the price of Hyperliquid’s native token.
Hyperliquid’s network decline warns of a user activity slump
Hyperliquid network statistics suggest that cryptocurrency market traders are spooked, hesitating after the flash crash on October 10, which resulted in $19 billion in liquidations.
According to the official Hyperliquid statistics, the total Open Interest (OI), the notional value of all standing contracts on the platform, was at $7.20 billion on Friday, down from $15.10 billion on October 9. The more than 50% decline in the OI suggests a risk-off sentiment among traders, which could negatively impact the demand for Hyperliquid and its HYPE native token.
The drop in inflows corroborates a decline in user activity, as the data shows that consistent outflows last week dropped the cumulative inflows to $4.50 billion on Friday. If the declining trend in OI continues amid rising outflows, Hyperliquid could face a significant issue with user activity.
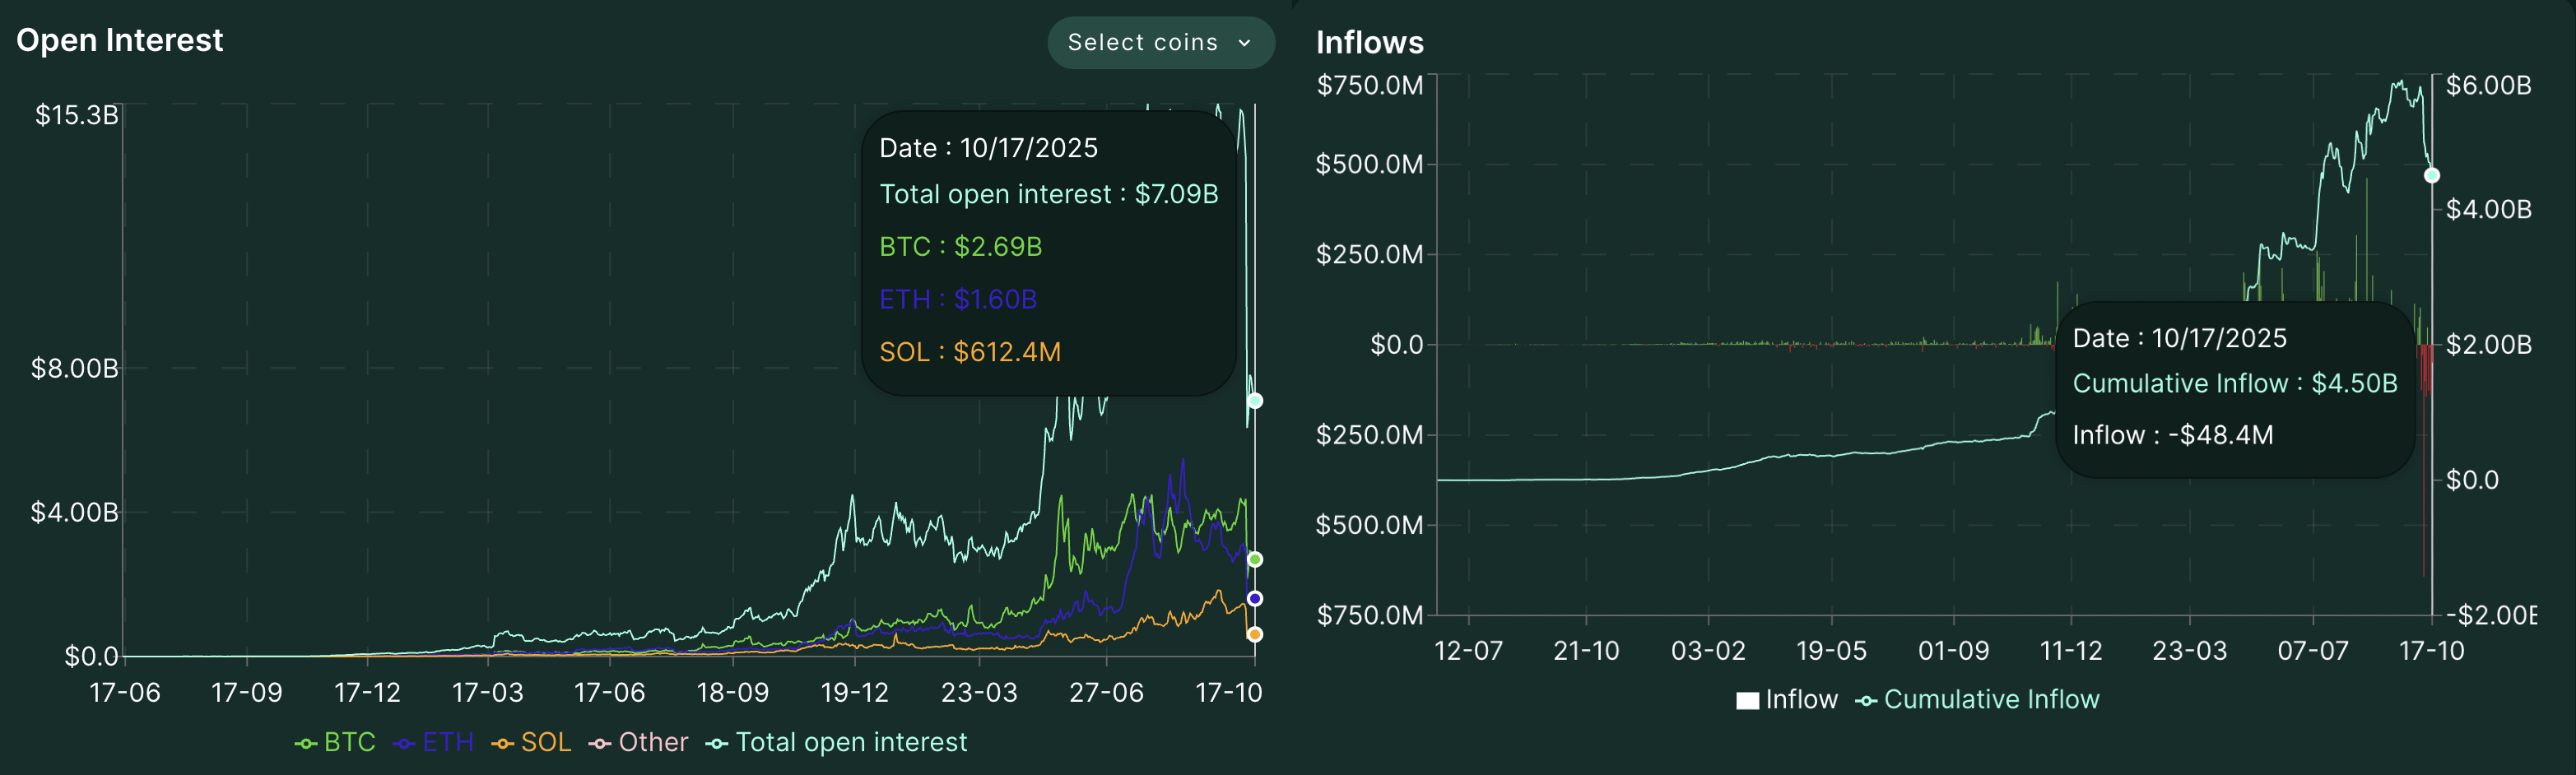
Hyperliquid network statistics.
On the other hand, the Hyperliquid Assistance Fund has acquired a total of 33.53 million HYPE tokens worth over $1.29 billion. This buyback trend on a revenue-based model indicates the company's underlying confidence and reduces circulation to boost demand.
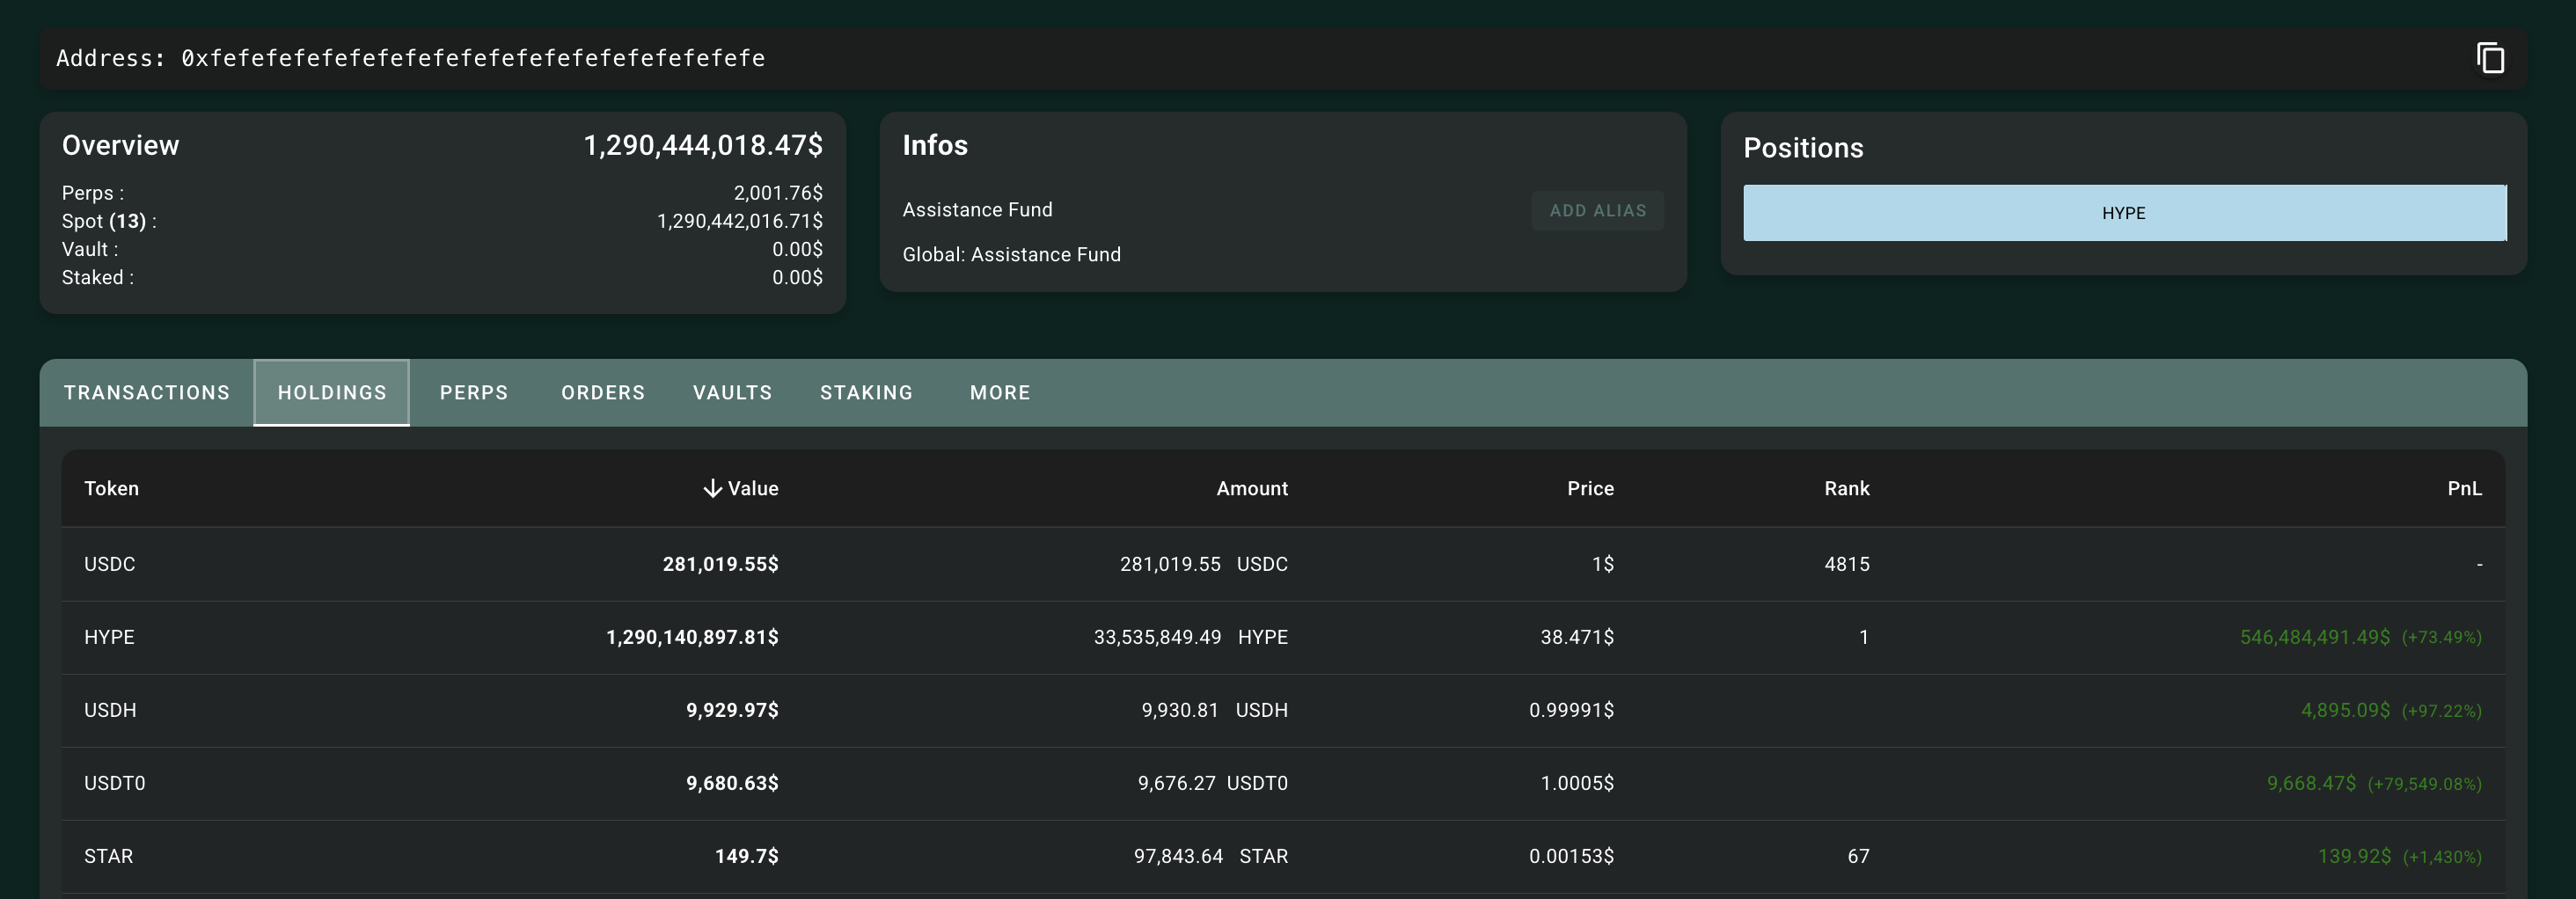
Hyperliquid Assistance Fund. Source: Hypurscann
Retail interest surge anticipates further gains
Despite declining user activity, renewed retail interest in the HYPE token reflects traders’ anticipation of a potential recovery. CoinGlass data shows that the HYPE OI stands at $1.34 billion on Monday, a 2.45% increase in the last 24 hours, indicating that traders are willing to take more risk by either building more long positions or increasing leverage.
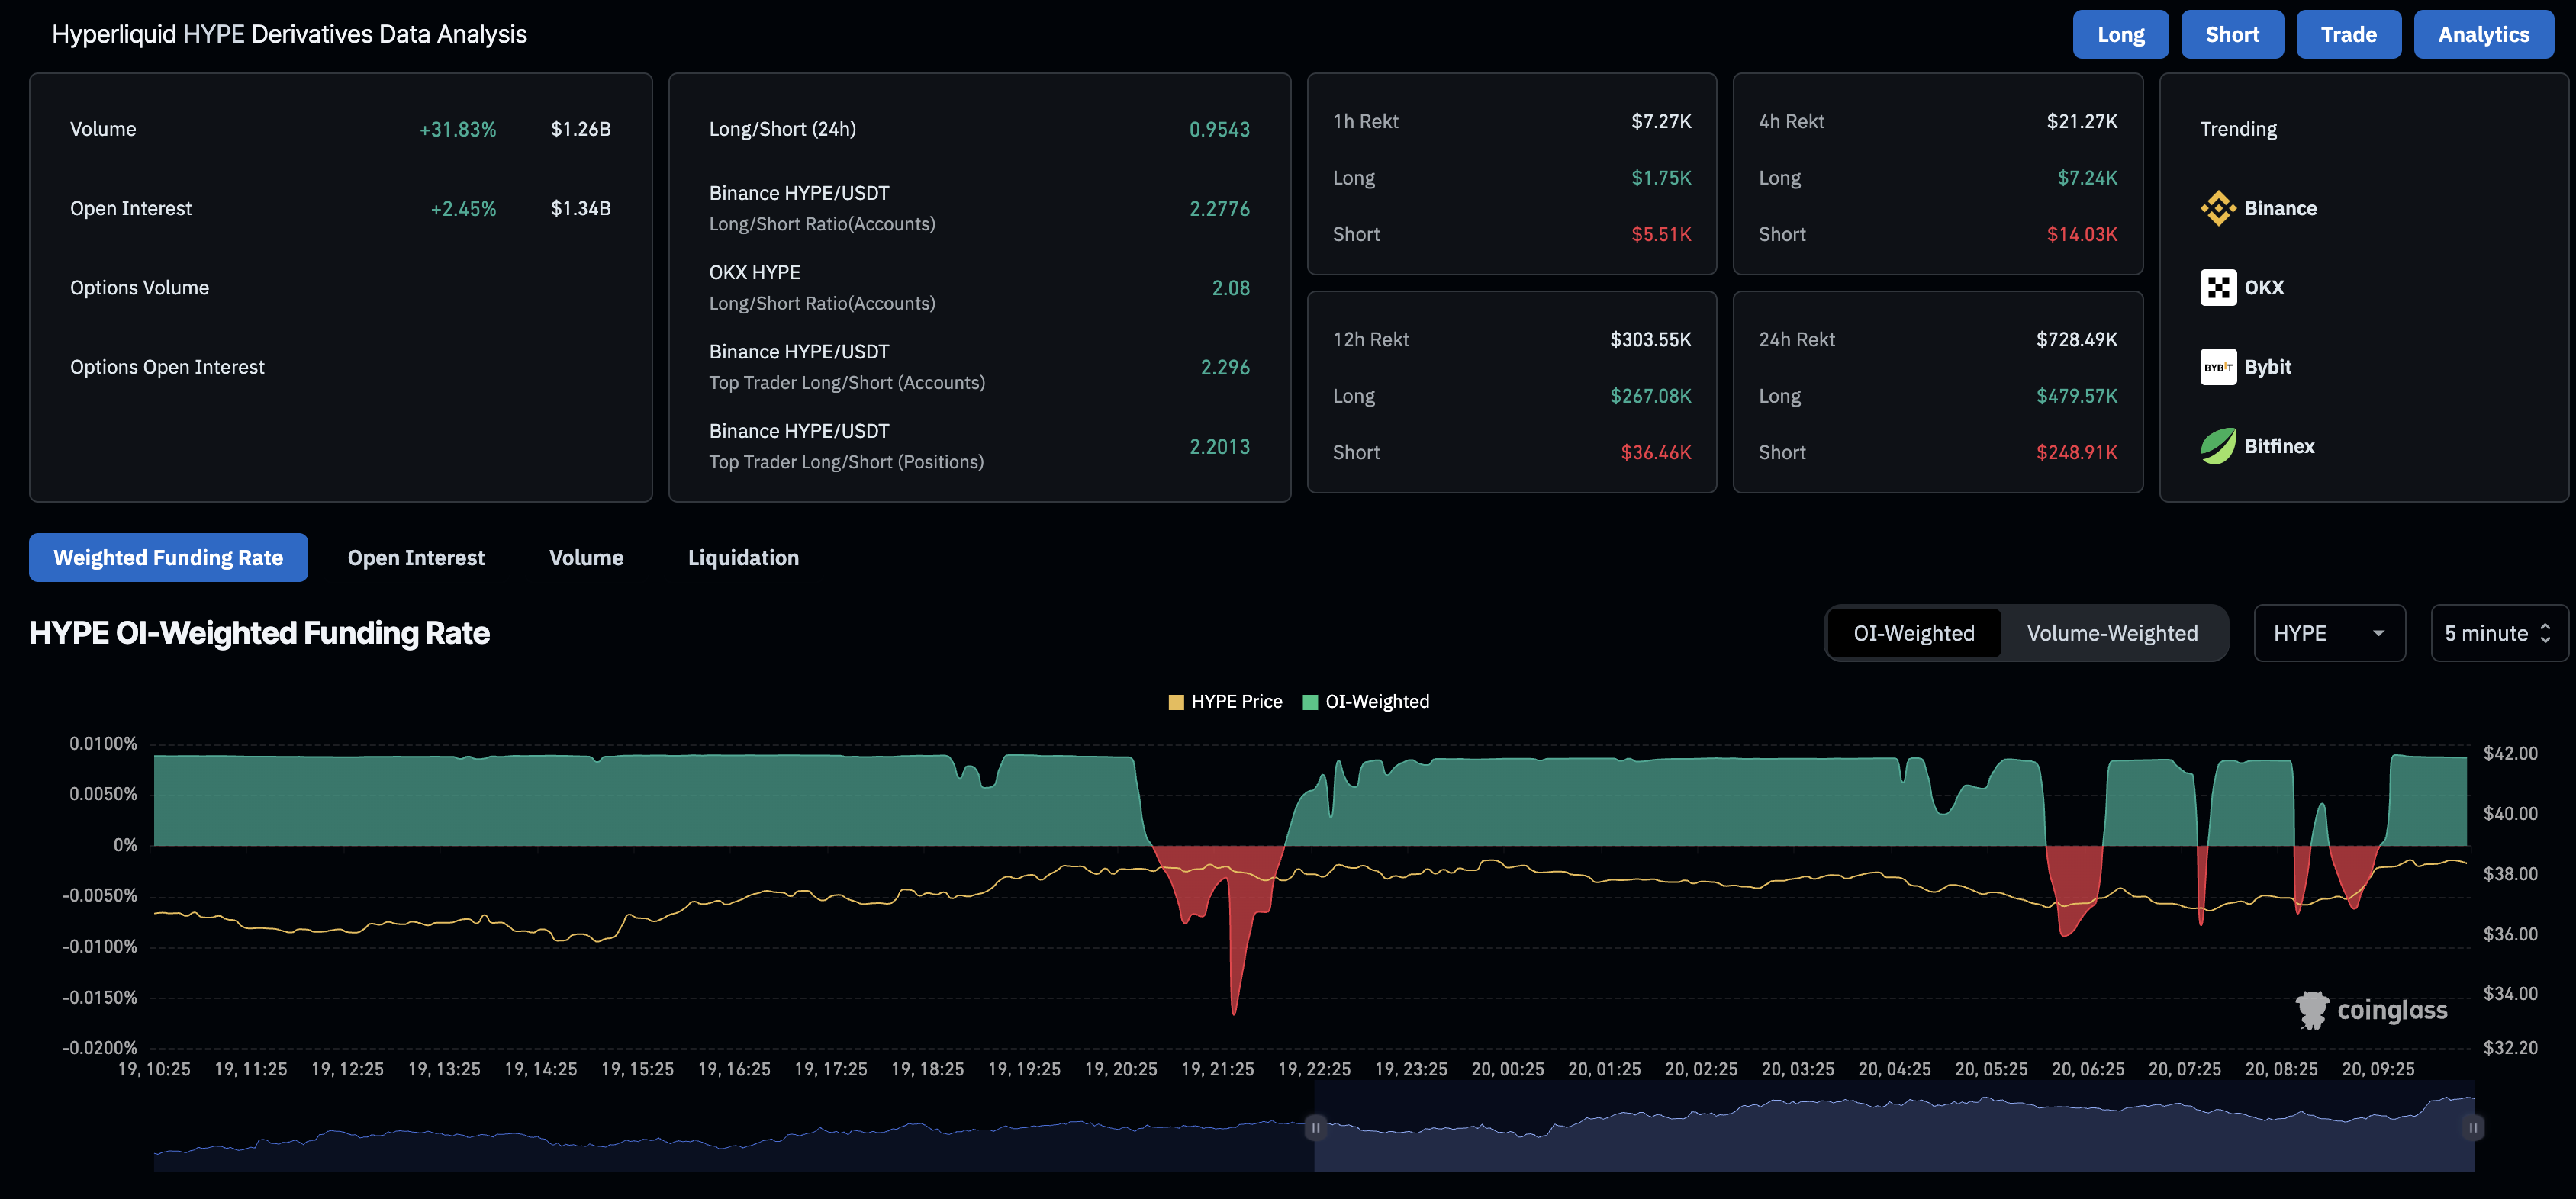
Hyperliquid derivatives data. Source: CoinGlass
Hyperliquid reclaims the 200-day EMA as bulls target $48
Hyperliquid ticks higher for the third consecutive day, trading above $38 and the 200-day EMA. A decisive close above this average line could target the 100-day EMA at $43, followed by the Pivot Point level at $48.
At the same time, a potential extension in the recovery run could offset an impending bearish crossover of the 50-day and 100-day EMAs.
Meanwhile, the momentum indicators on the daily chart suggest a decline in selling pressure as the Moving Average Convergence Divergence (MACD) recovers to its signal line, hinting at a potential upward shift with a crossover, which could confirm renewed bullish momentum.
The Relative Strength Index (RSI) on the same chart reads 42, rising from the oversold zone, suggesting a decline in bearish strength.
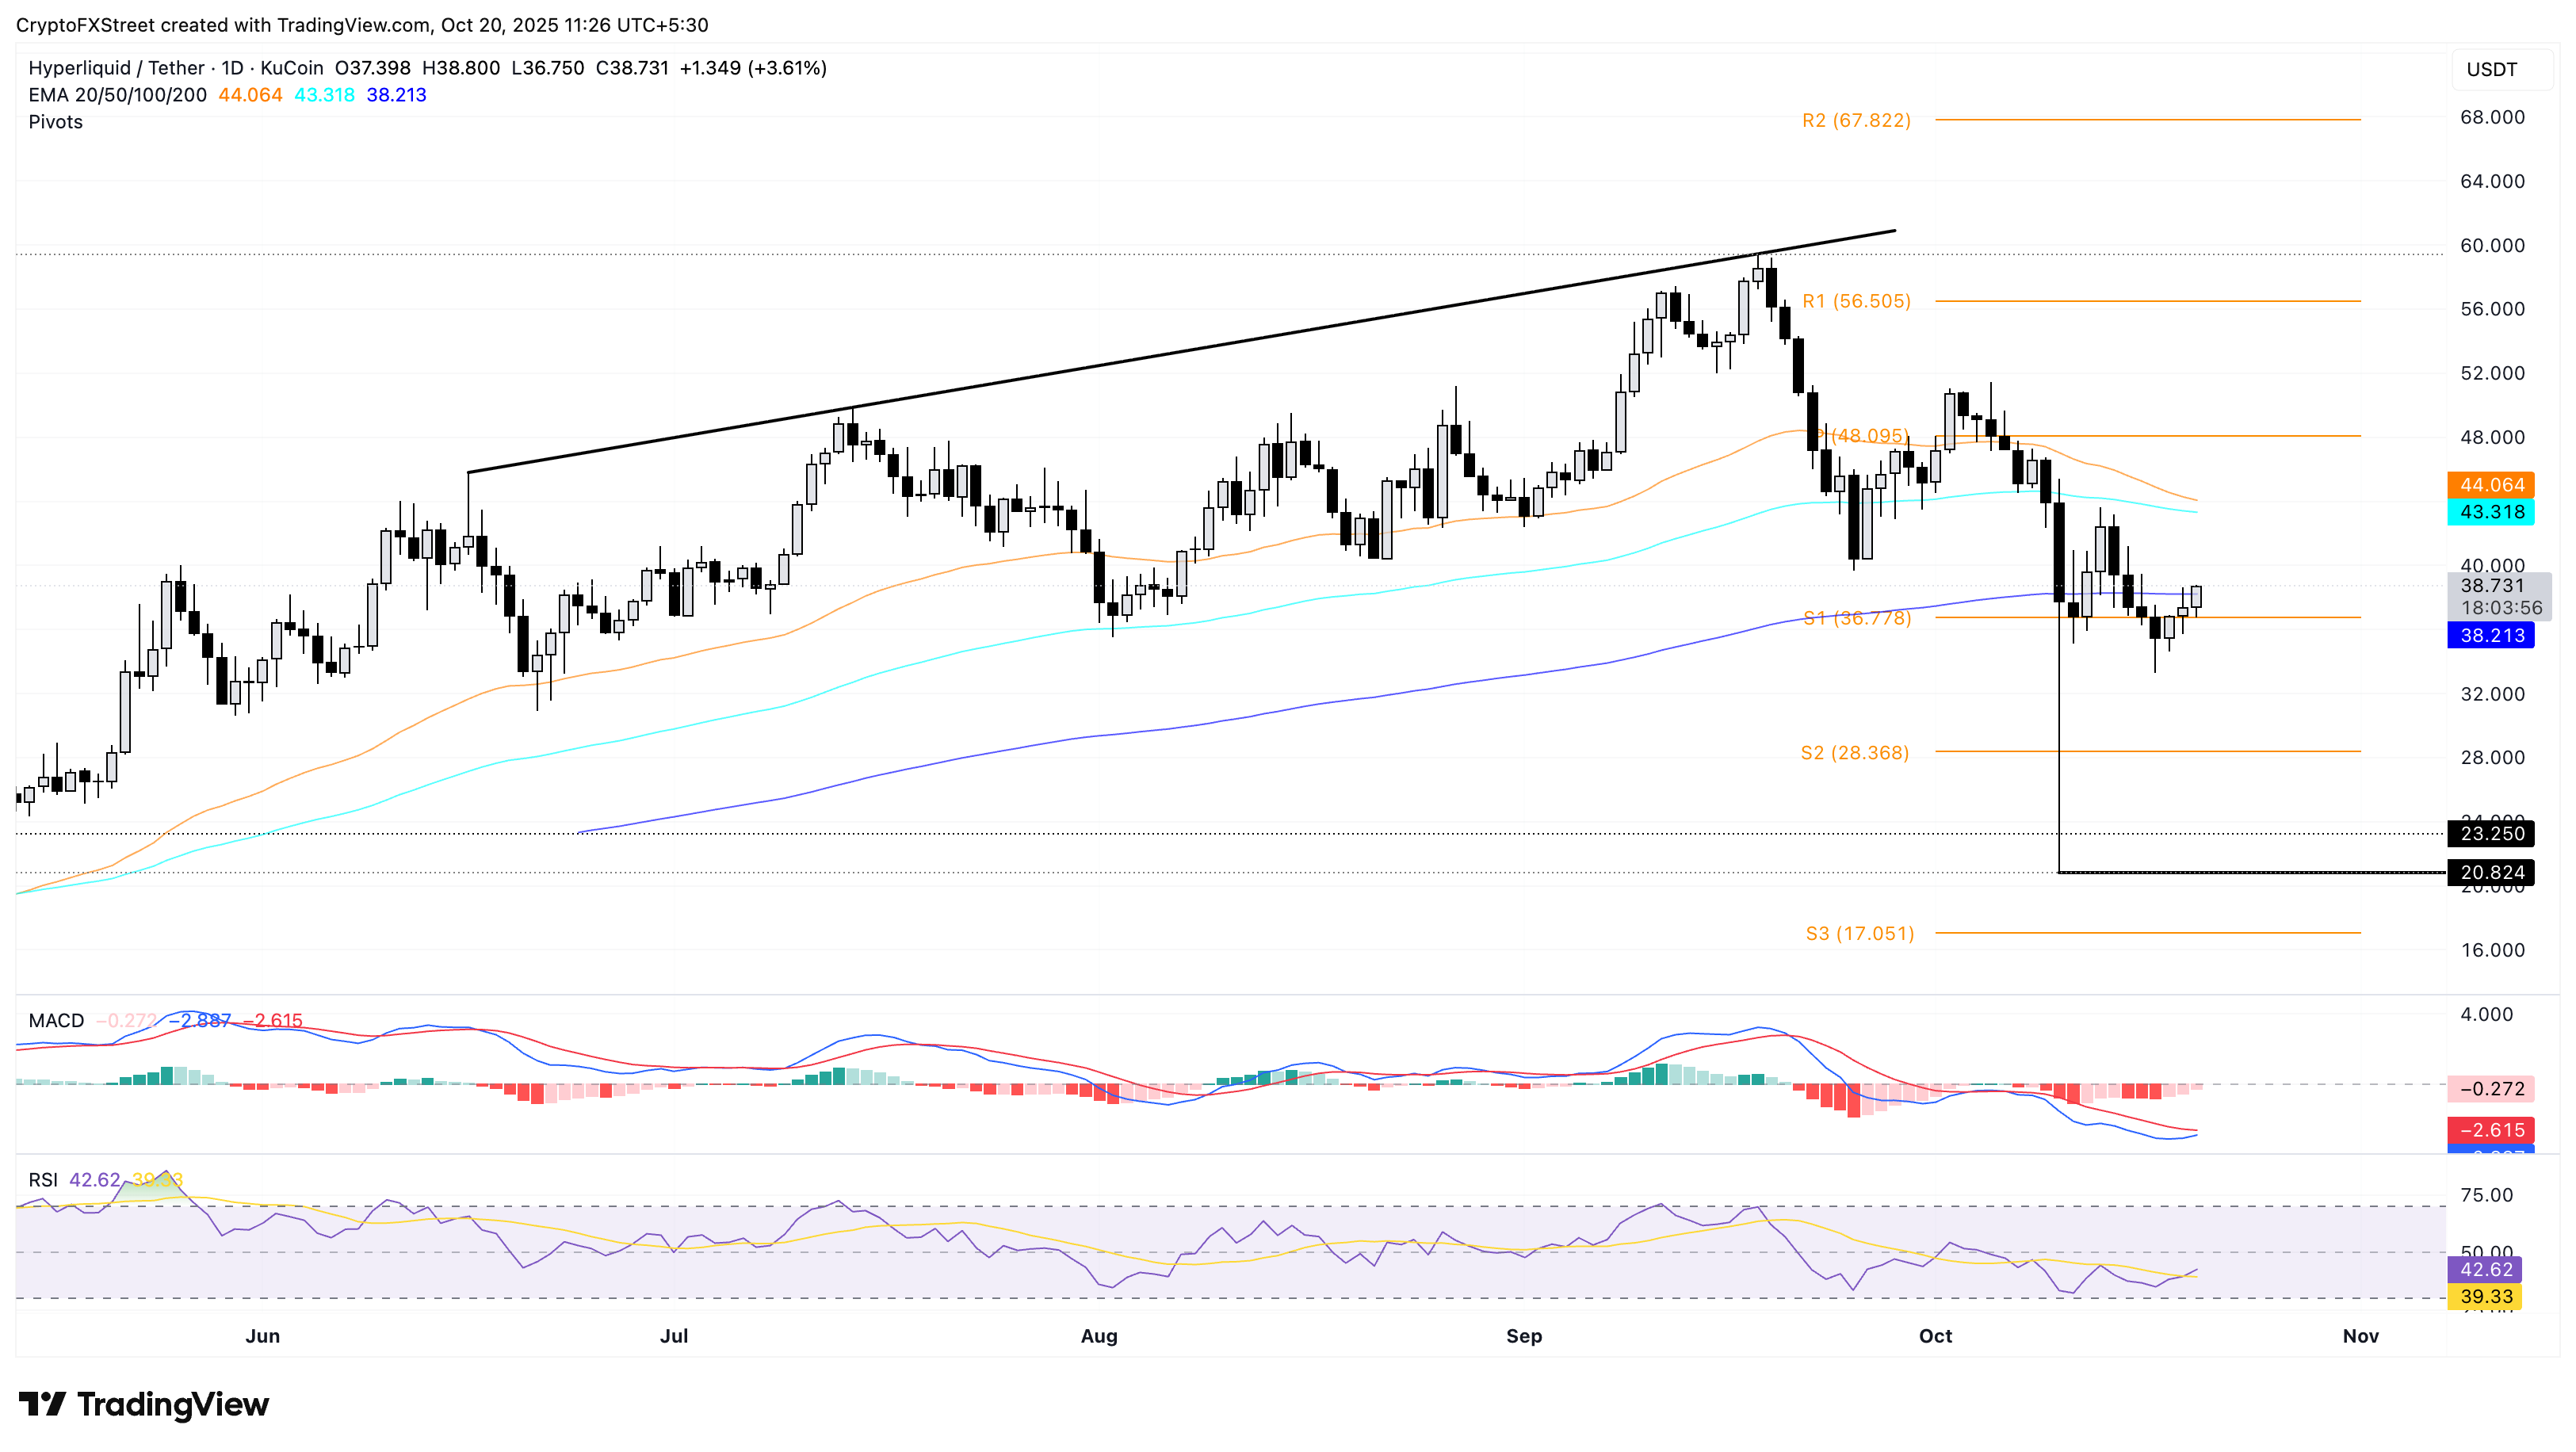
HYPE/USDT daily price chart.
On the downside, if HYPE fails to sustain above the 200-day EMA at $38, it could slip to the S2 Pivot Point level at $28.
Author

Vishal Dixit
FXStreet
Vishal Dixit holds a B.Sc. in Chemistry from Wilson College but found his true calling in the world of crypto.




