HYPE, SPX, and FET lead the losses as crypto market liquidations cross $650 million
- Hyperliquid extends the 7% loss from Tuesday, risking a breakdown of the 200-day EMA.
- SPX6900 gains bearish momentum, with bears eyeing the $1 retest.
- Artificial Superintelligence Alliance token marked its lowest daily close in nearly two years, eyeing further losses.

Hyperliquid (HYPE), SPX6900 (SPX), and Artificial Superintelligence Alliance (FET) are leading the losses over the last 24 hours as the crypto market faces renewed selling pressure.
The crypto market suffered $655 million in total liquidations over the last 24 hours as tariff tensions between the US and China increased. US President Donald Trump mentioned a potential halt in the cooking oil trade with China, which led to Bitcoin dropping below $113,000 and pressured other top altcoins.
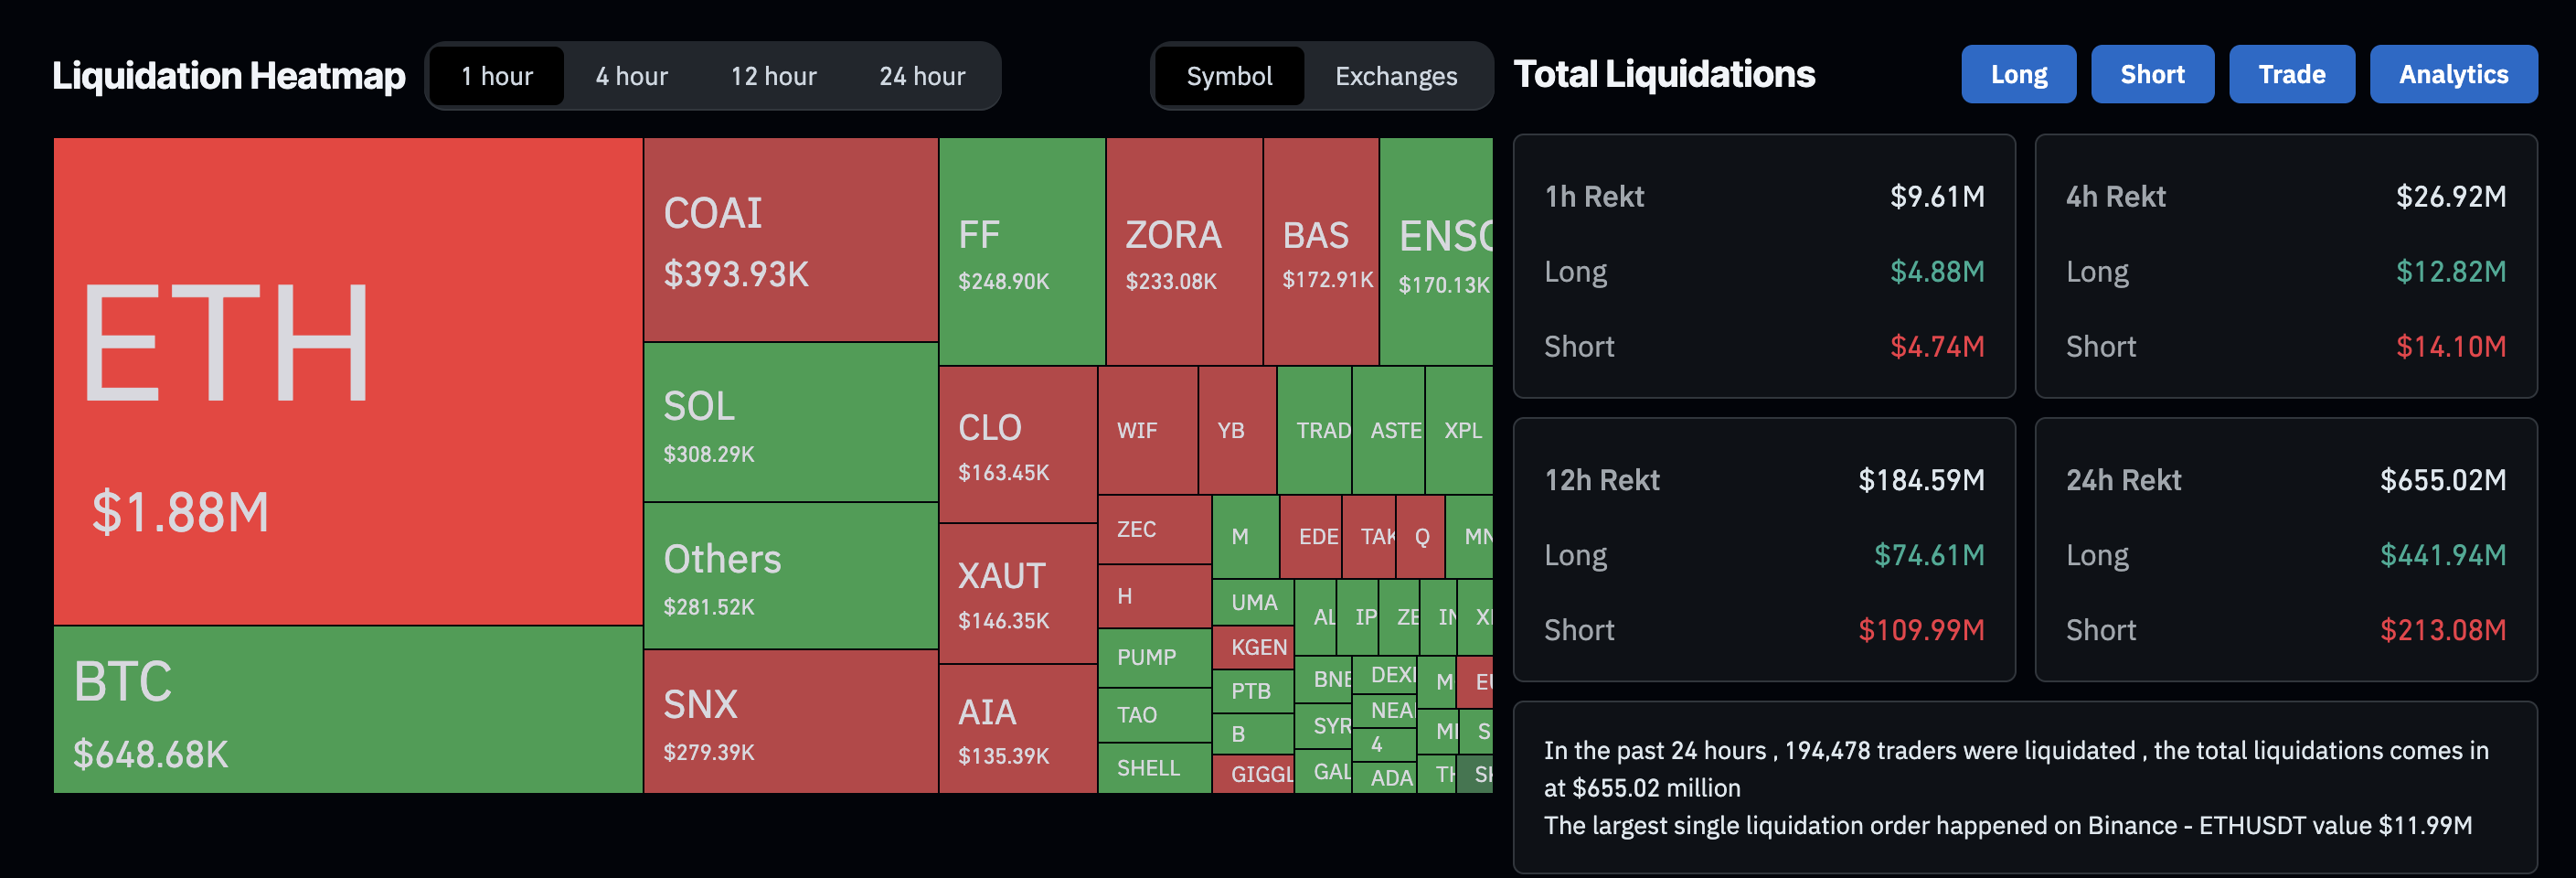
Crypto market liquidations. Source: CoinGlass
Technically, the top decliners risk further losses as bearish momentum increases.
Hyperliquid pullback risks a drop below $30
Hyperliquid edges lower by over 1% at press time on Wednesday, extending the 7% loss from Tuesday. The pullback in Decentralized Exchange (DEX) token erases the Monday gains and risks a potential drop below the 200-day Exponential Moving Average (EMA) at $38.28.
The S1 Pivot Point level at $36.77 could act as the immediate support, which provided a bouncepad on Sunday. If HYPE marks a daily close below this level, it could extend the decline to the centre Pivot Point level at $28.36.
The technical indicators on the daily chart suggest a bearish dominance as the Moving Average Convergence Divergence (MACD) extends the declining trend in the negative territory.
Additionally, the Relative Strength Index (RSI) at 39 on the same chart indicates room for further correction before reaching the oversold zone.
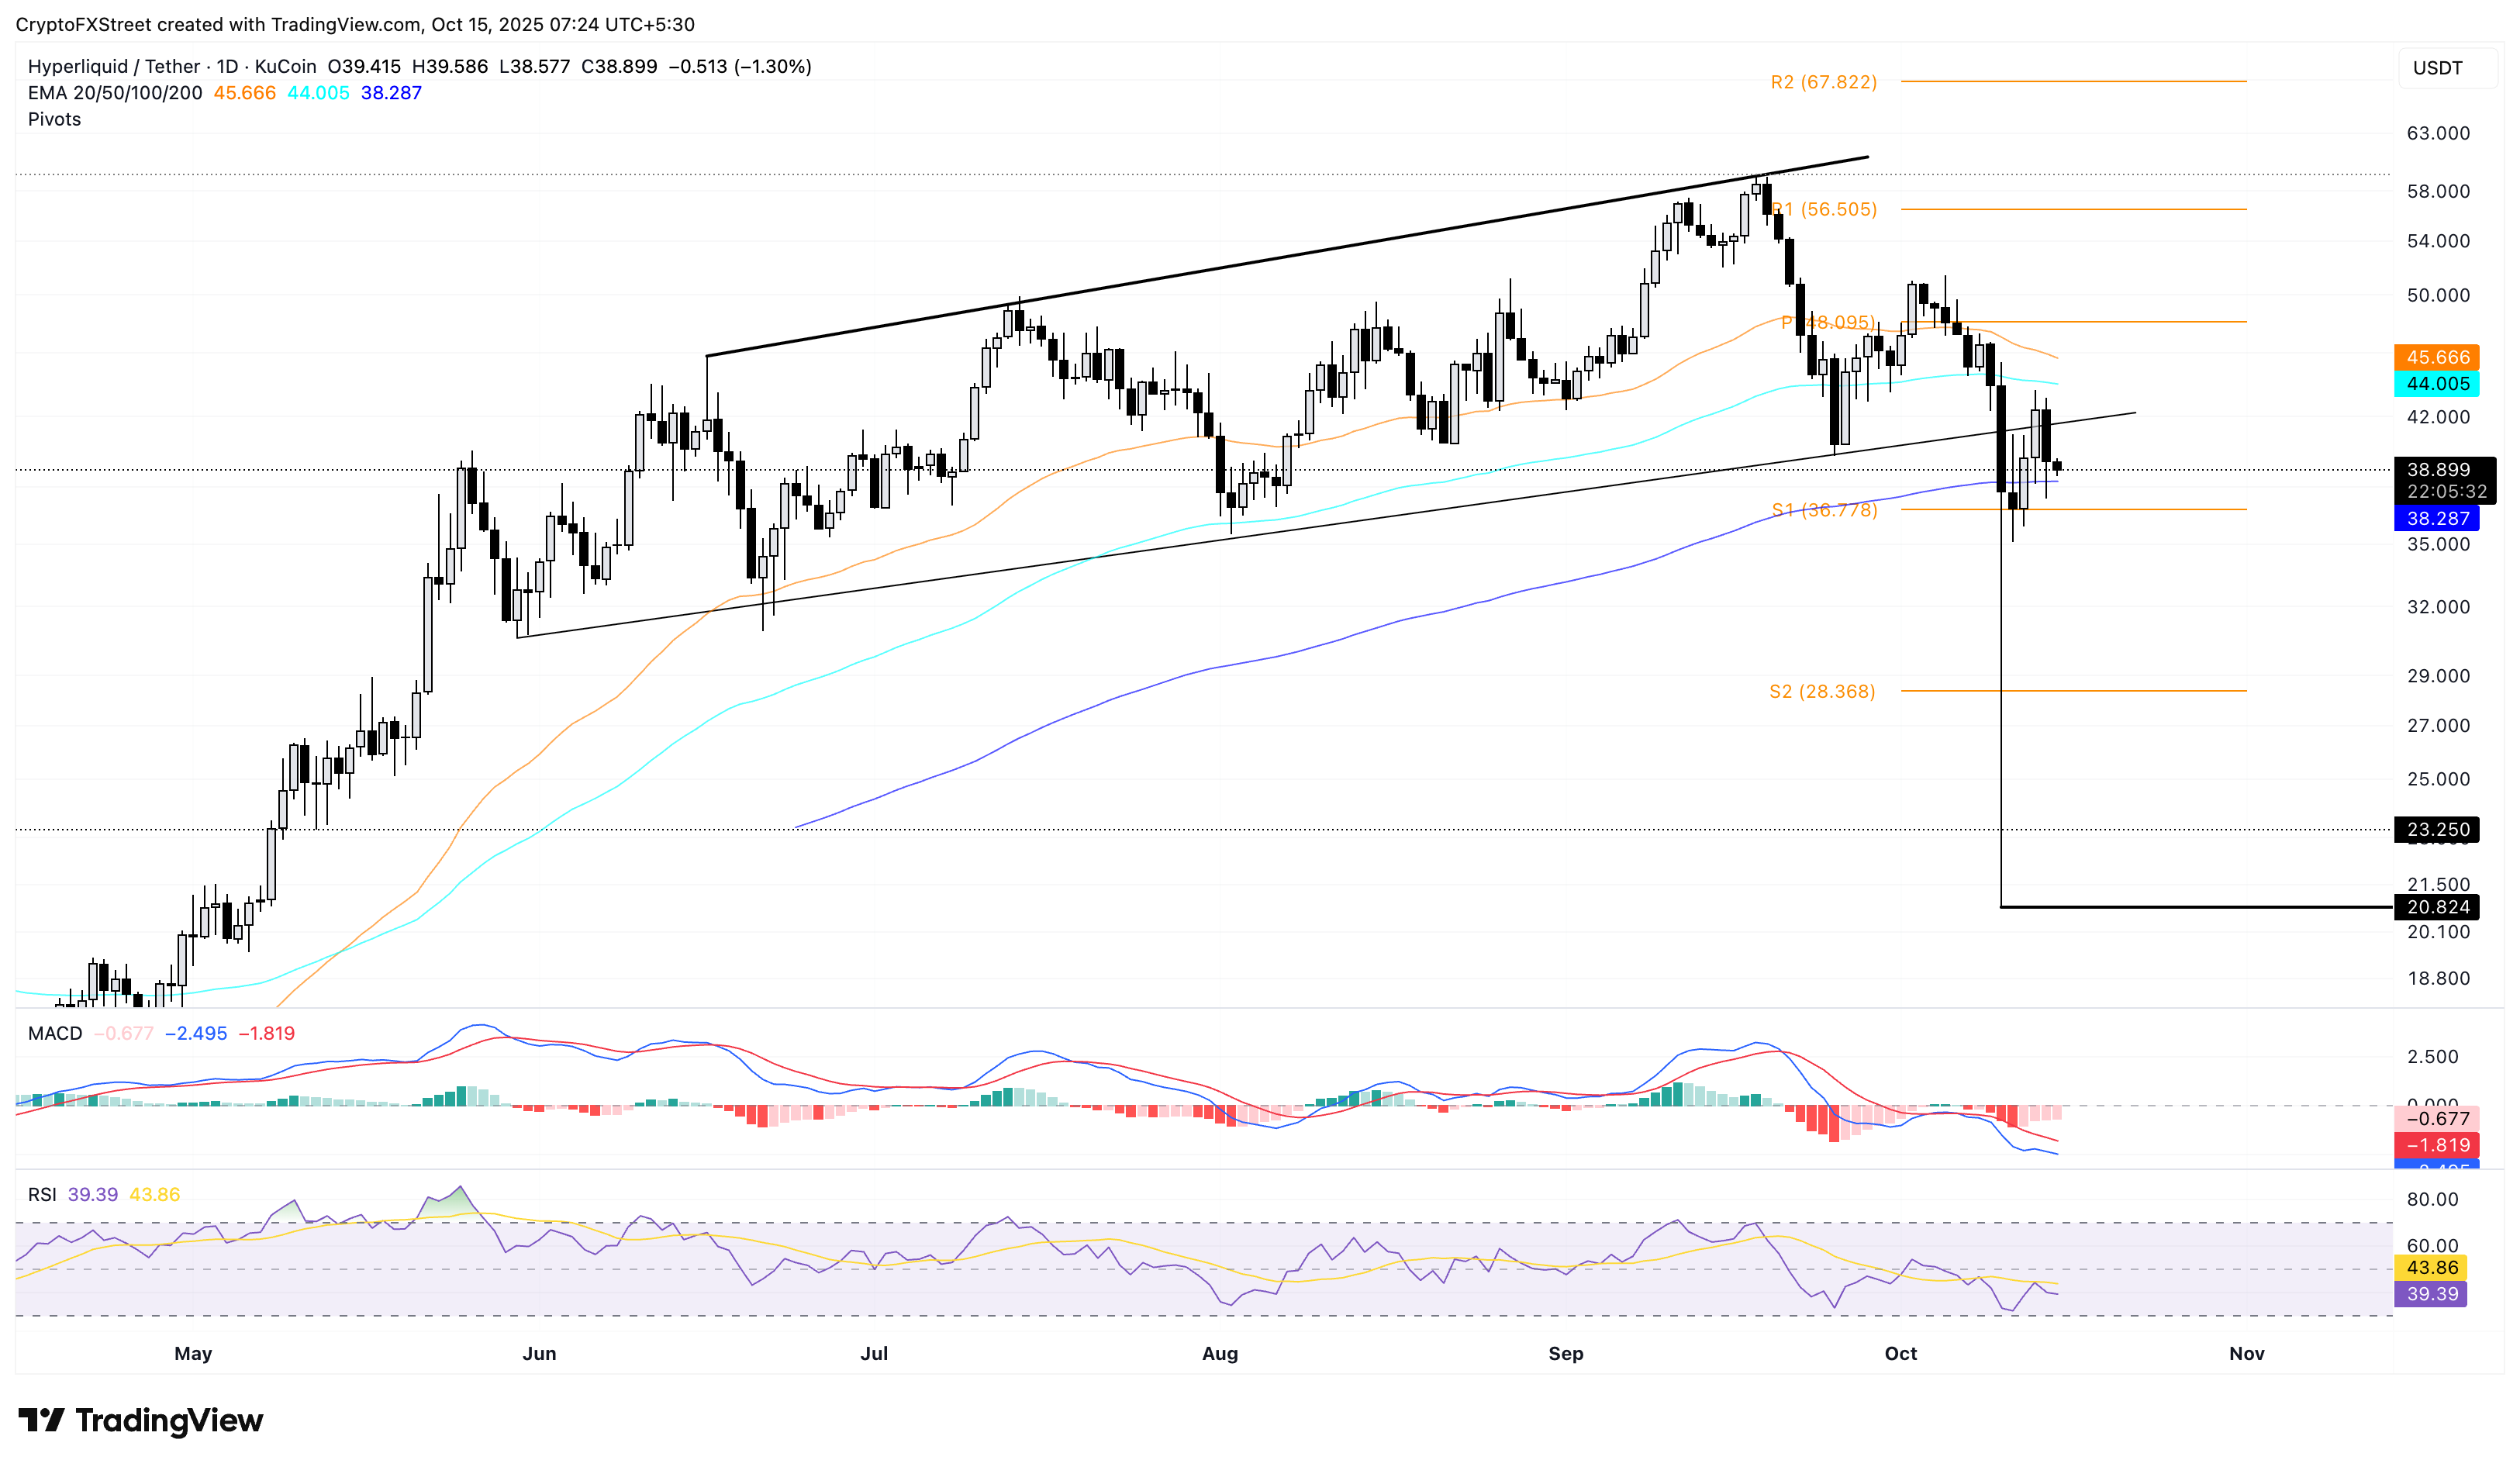
HYPE/USDT daily price chart.
Looking up, a bounce back in HYPE should surpass the 50-day EMA at $45.66 to reclaim bullish momentum and could find overhead winds at the centre Pivot Point level at $48.09.
SPX6900 bears target the $1 psychological support
SPX6900 ticks lower by 1% at the time of writing on Wednesday, advancing the 10% decline from the previous day. The meme coin remains weak after the Friday crash, with intraday pullback risks erasing the 28% gains from Sunday.
If the pullback extends, SPX could breach the $1.00 psychological level to test the $0.90 support level marked by the May 31 low.
The MACD diverges to the downside from its signal line, indicating a rise in selling pressure. Additionally, the RSI at 46 falls below the halfway line, maintaining a neutral to bearish stance.
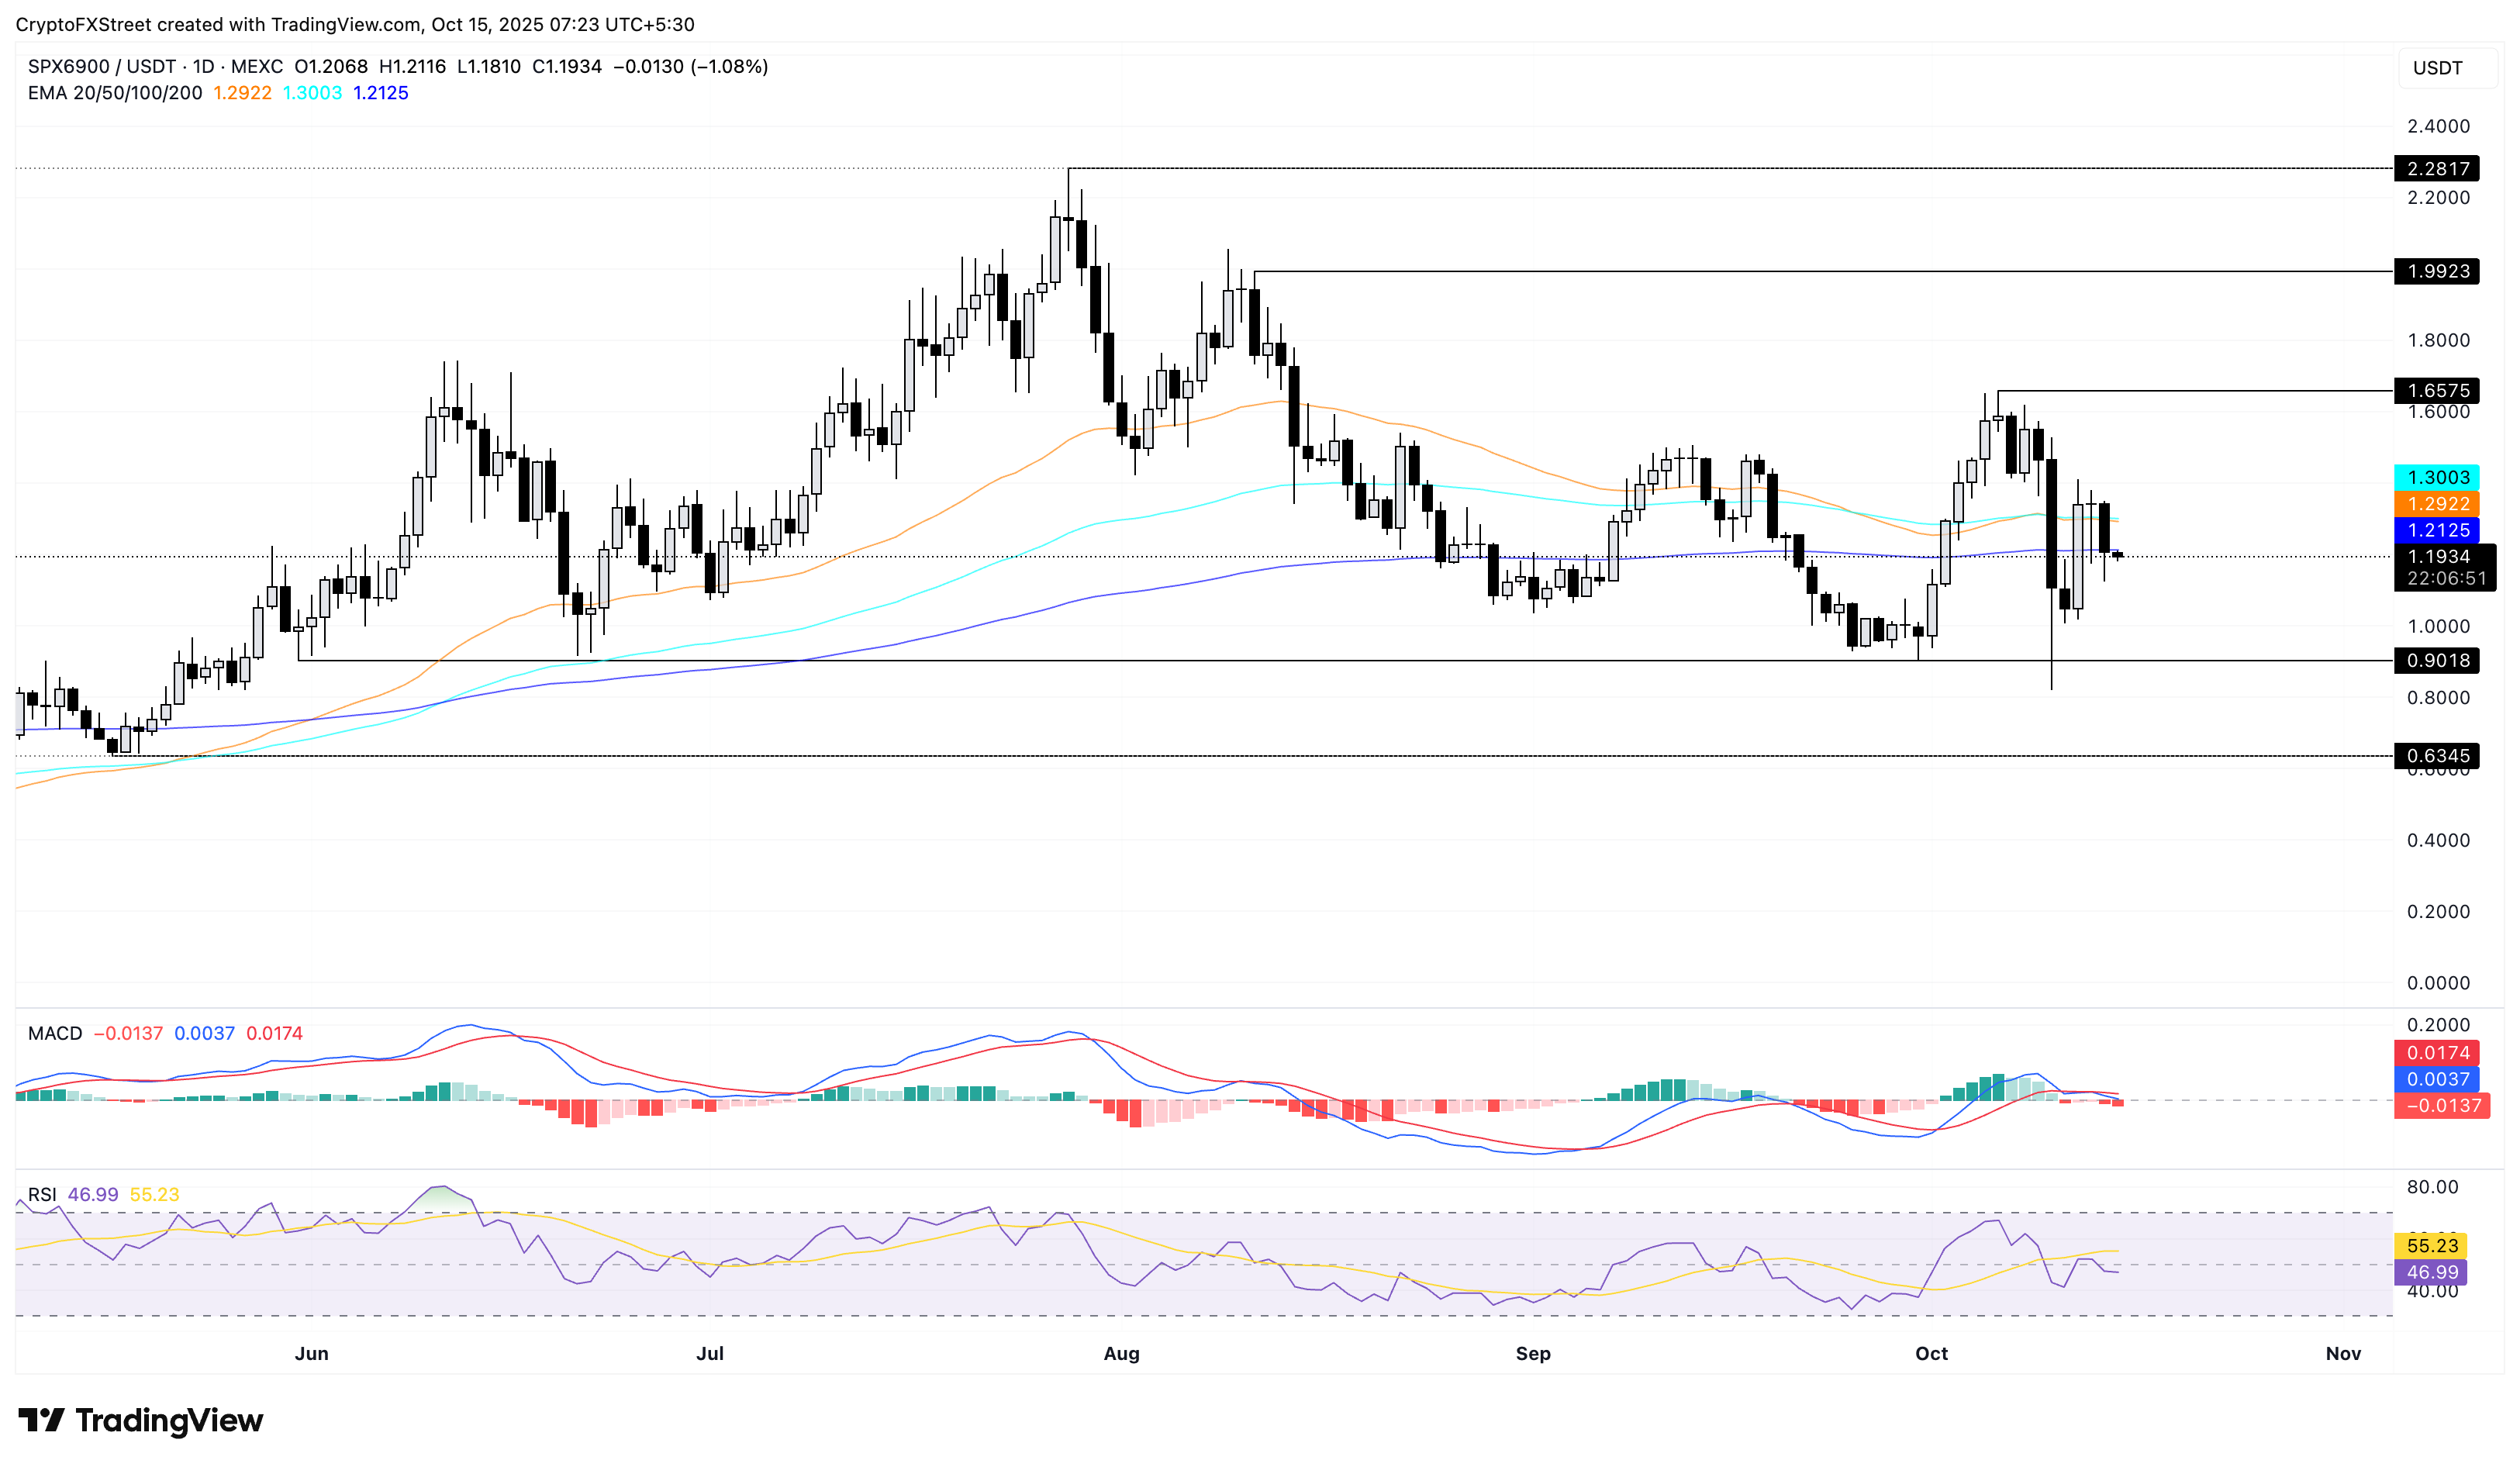
SPX/USDT daily price chart.
On the other hand, if SPX survives the market volatility, it could stage a recovery run to the $1.65 peak from October 6.
FET risks further losses as selling pressure increases
Artificial Superintelligence Alliance token marked its lowest daily close in nearly two years on Tuesday. At the time of writing, FET trades above $0.3000 on Wednesday after breaking below the S3 Pivot Point level at $0.3310 on the previous day.
The immediate support for the declining AI token lies at the S4 Pivot Point level at $0.2270.
The declining trend gains traction as the MACD continues its free fall alongside its signal line. At the same time, the RSI at 21 moves sideways in the oversold zone, which indicates heightened selling pressure. Still, the oversold conditions bear the possibility of a potential bounce back as sellers saturate.
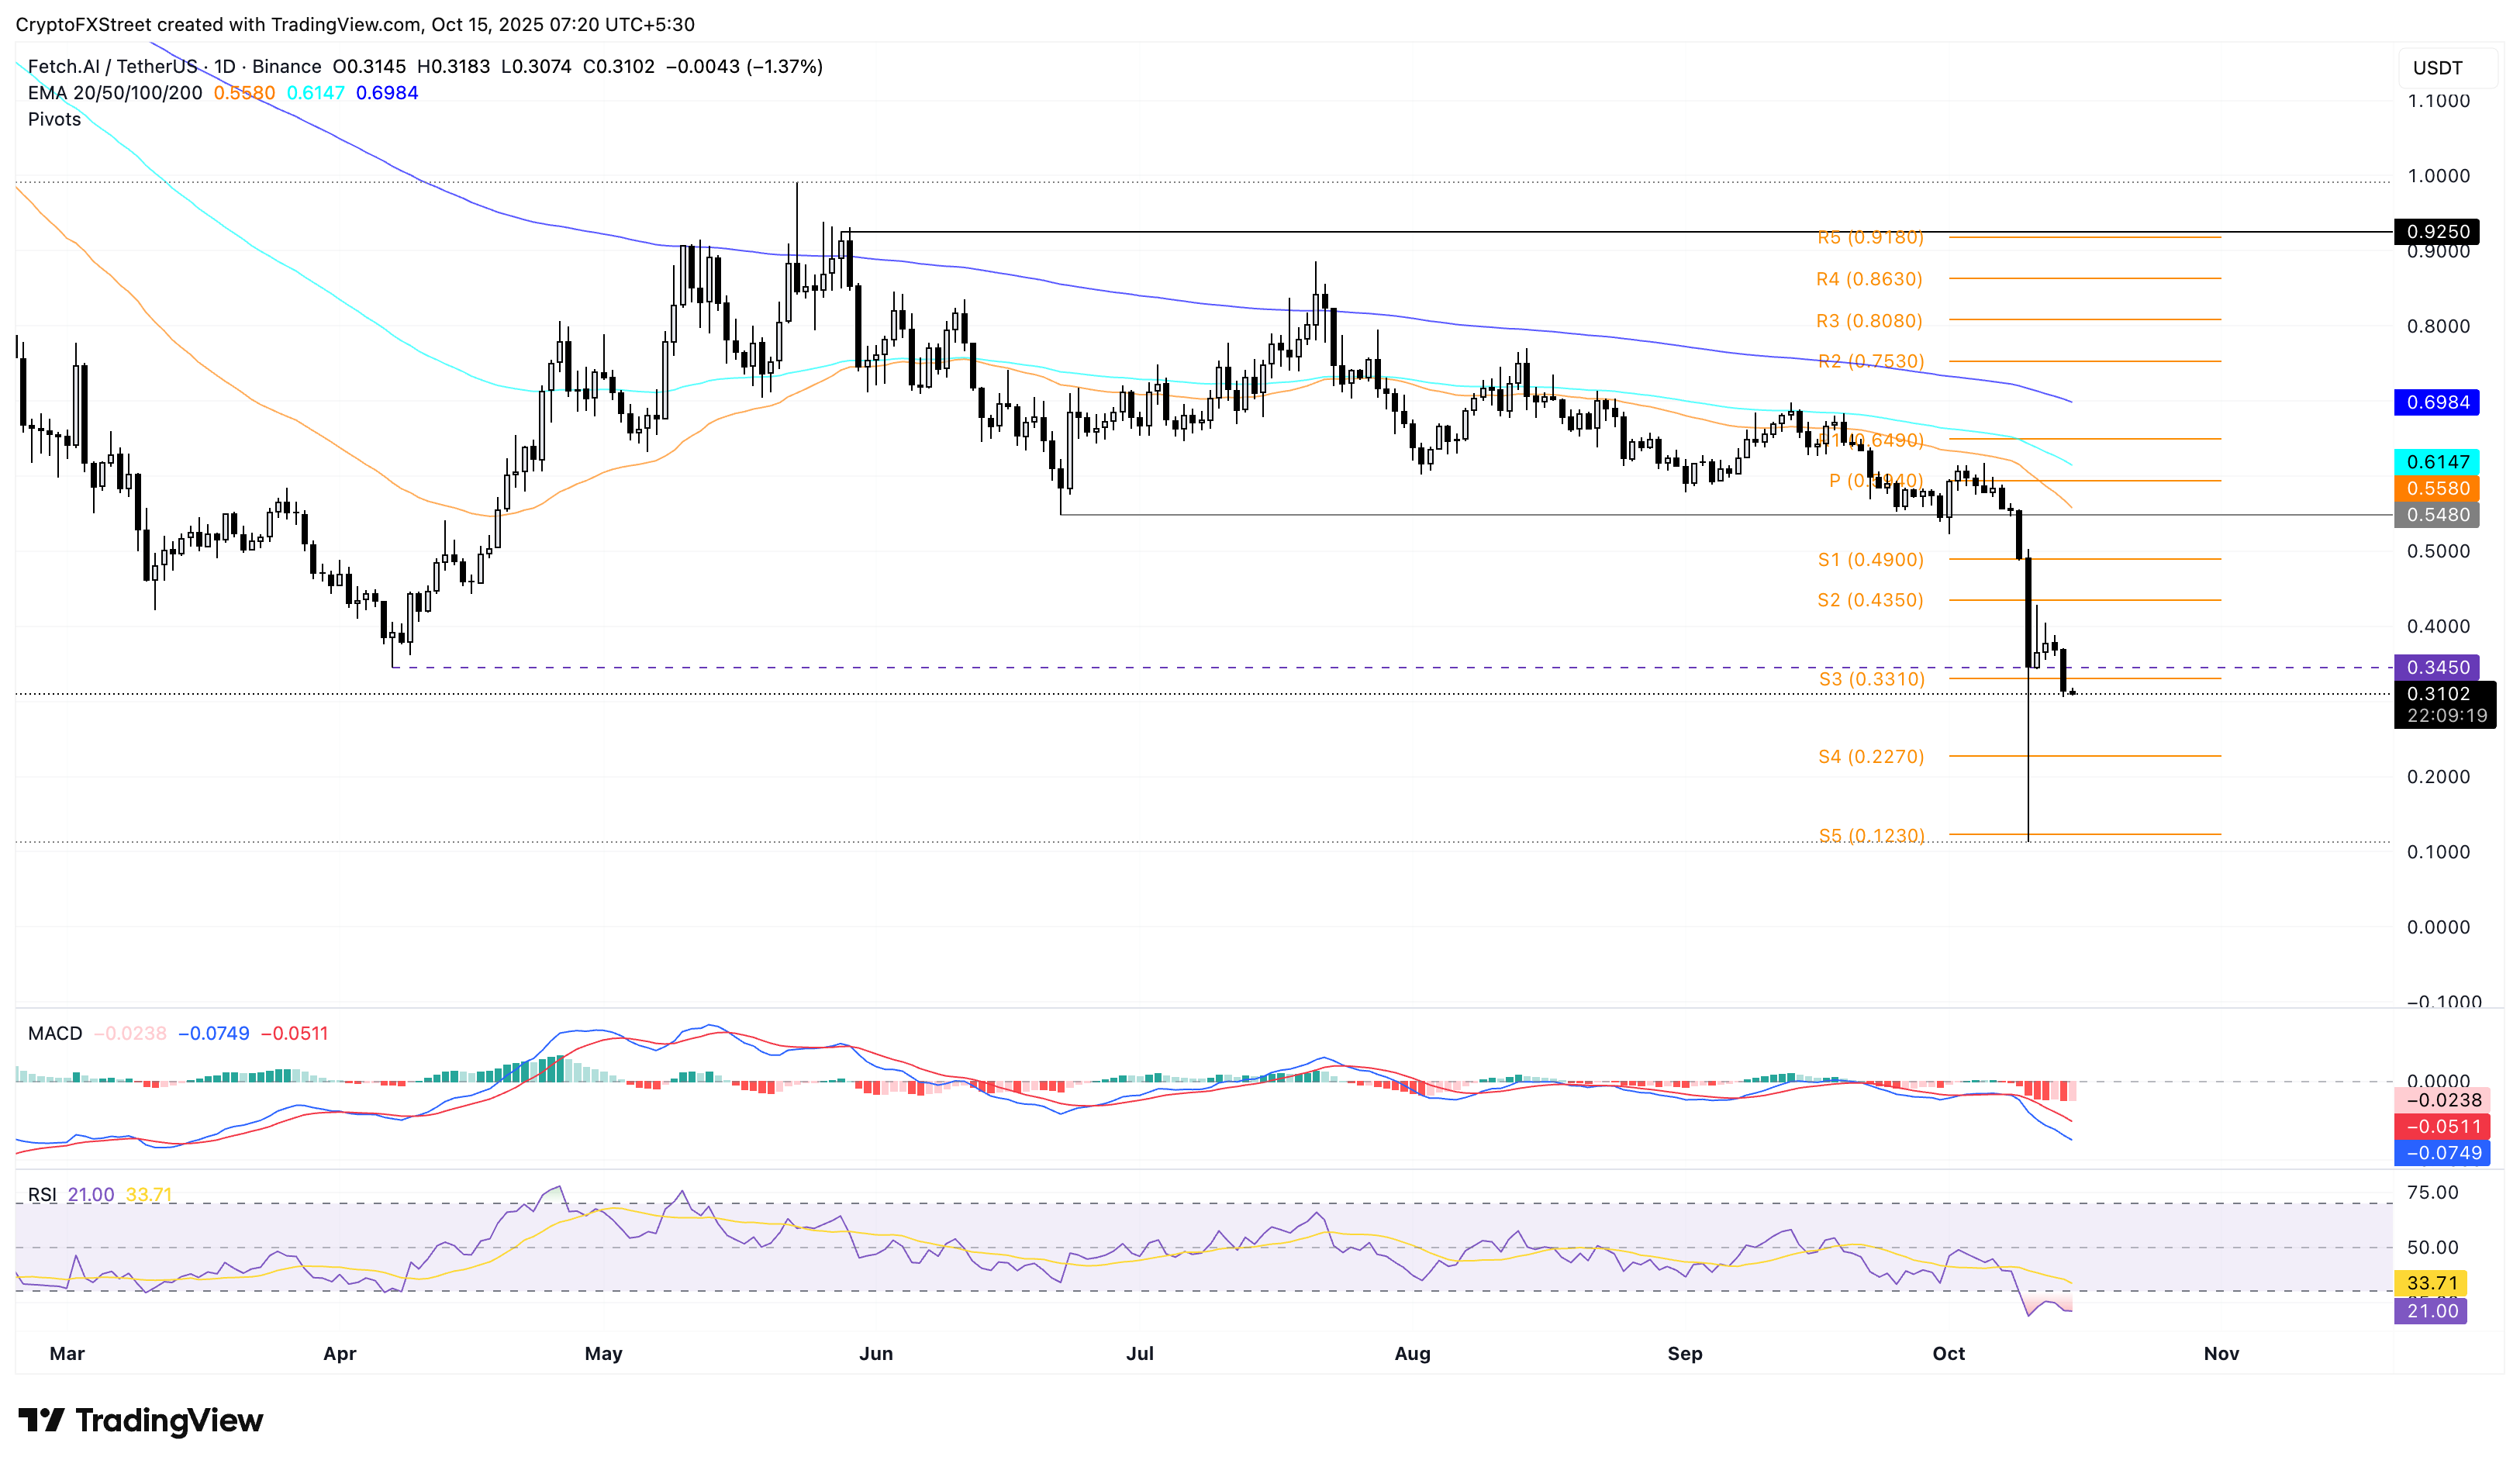
FET/USDT daily price chart.
Despite the grim outlook, a potential bounce back could face opposition from the support turned resistance S3 and S2 Pivot Point levels at $0.3310 and $0.4350, respectively.
Author

Vishal Dixit
FXStreet
Vishal Dixit holds a B.Sc. in Chemistry from Wilson College but found his true calling in the world of crypto.



