How great is the chance to see the bounceback of the market next week?

Most of the coins have come back to the previous levels as they are located in the green zone.
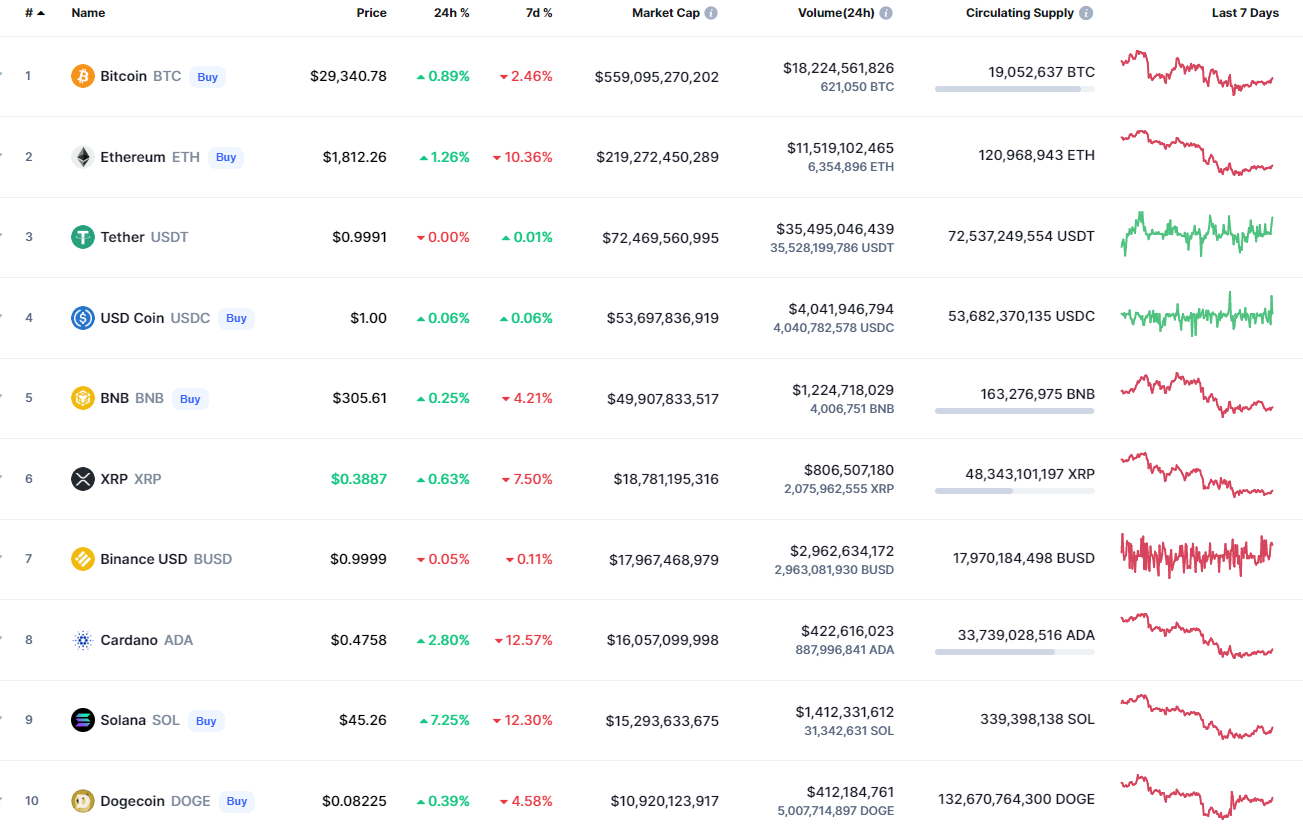
Top coins by CoinMarketCap
BTC/USD
Despite today's slight rise, the rate of Bitcoin (BTC) has gone down by 2.24% over the last seven days.
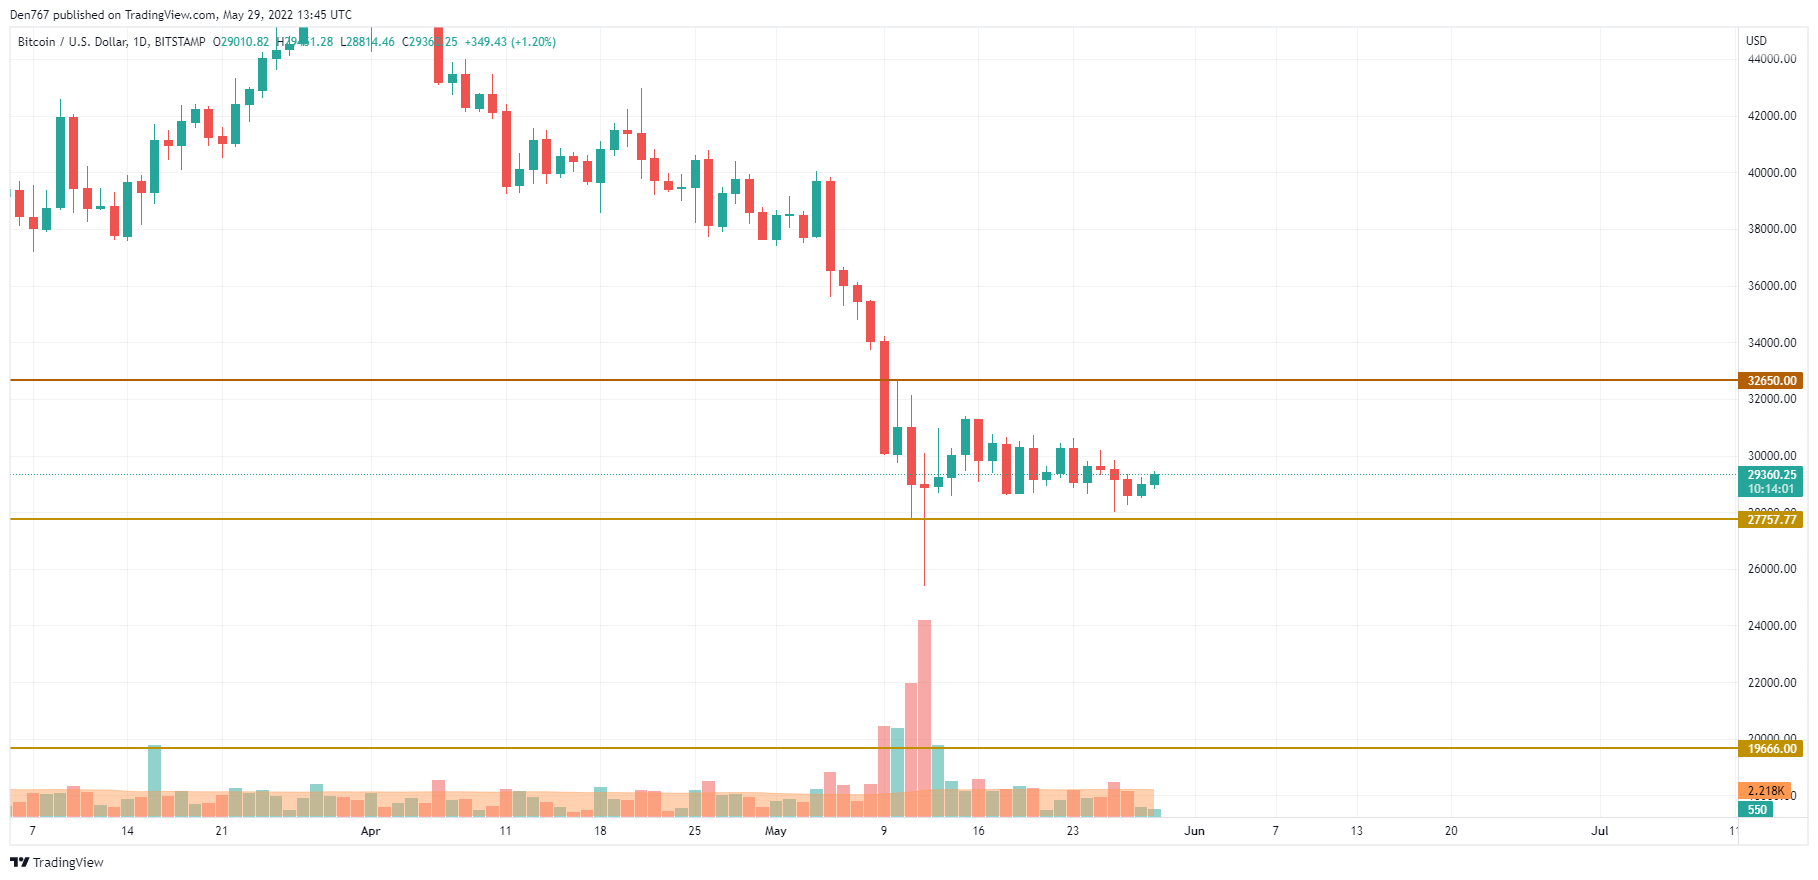
BTC/USD chart by TradingView
Bitcoin (BTC) remains trading above $29,000, which means that the growth may continue next week if they can hold the initiative. In this case, one should pay attention to the $30,000 mark, the test of which may be a prerequisite for the local trend change.
In this case, the upward move can lead to the growth of the resistance around $33,000.
Bitcoin is trading at $29,329 at press time.
ETH/USD
Ethereum (ETH) has lost more than Bitcoin (BTC) in terms of the weekly price change with a decline of 10%.
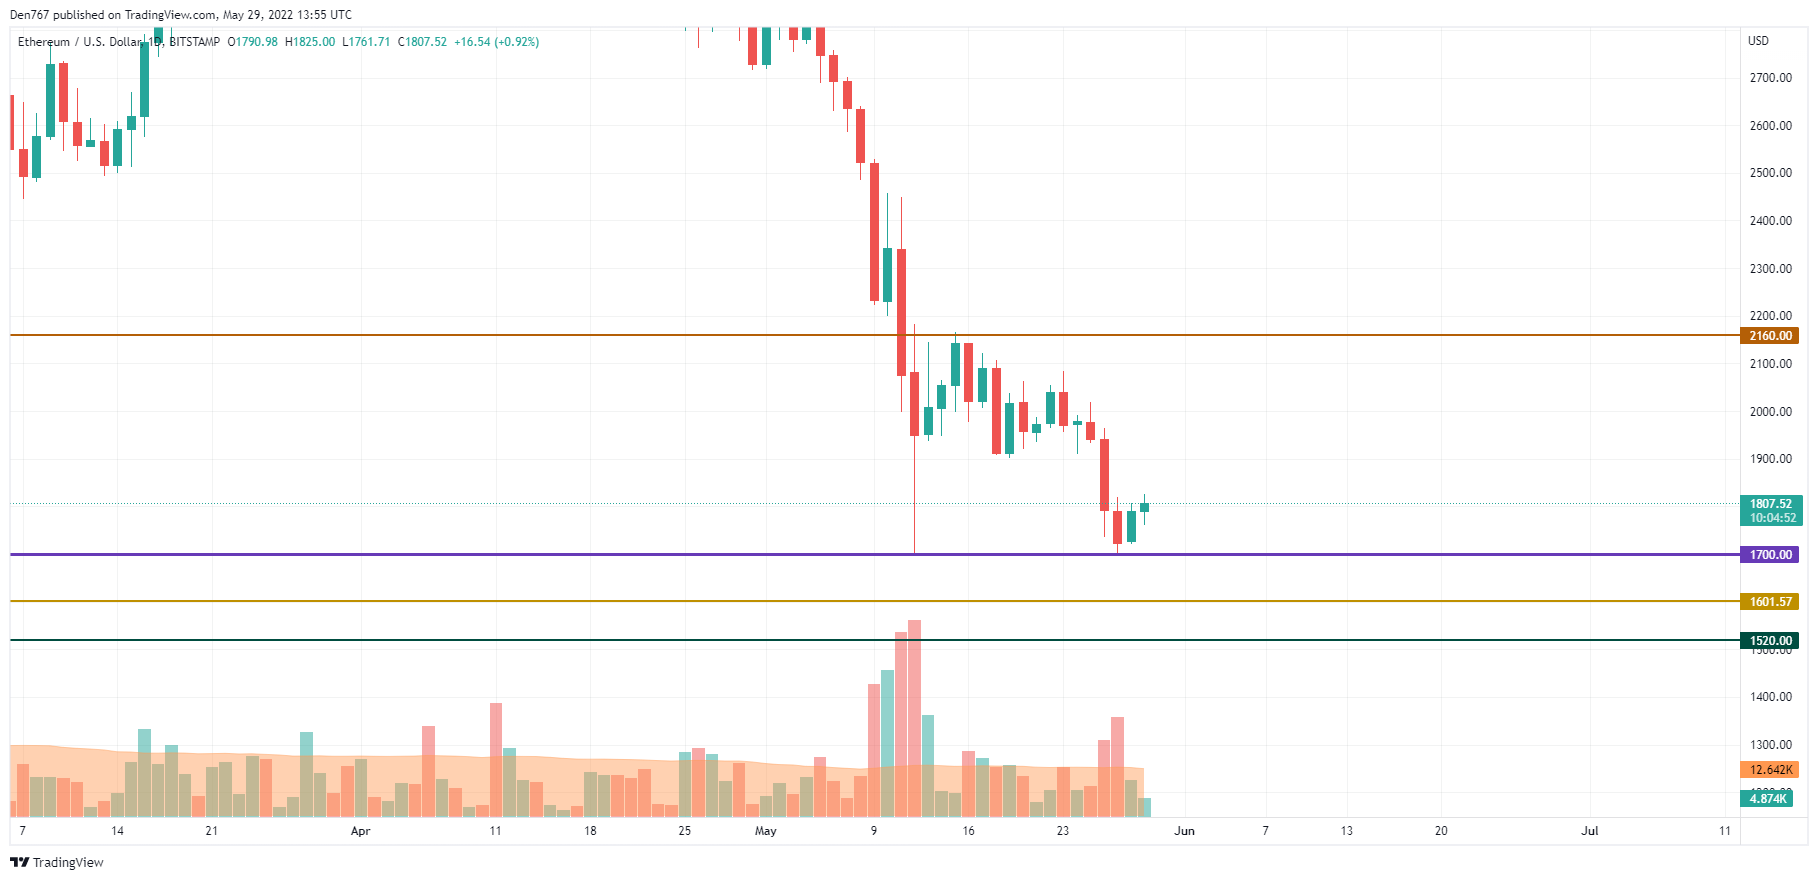
ETH/USD chart by TradingView
Ethereum (ETH) has come back above the $1,800 mark, which is also locally bullish for the main altcoin. If the buying trading volume increases, there are chances to expect the test of the $1,900 zone next week.
Ethereum is trading at $1,808 at press time.
BNB/USD
The rate of Binance Coin (BNB) has also gone down over the last seven days.
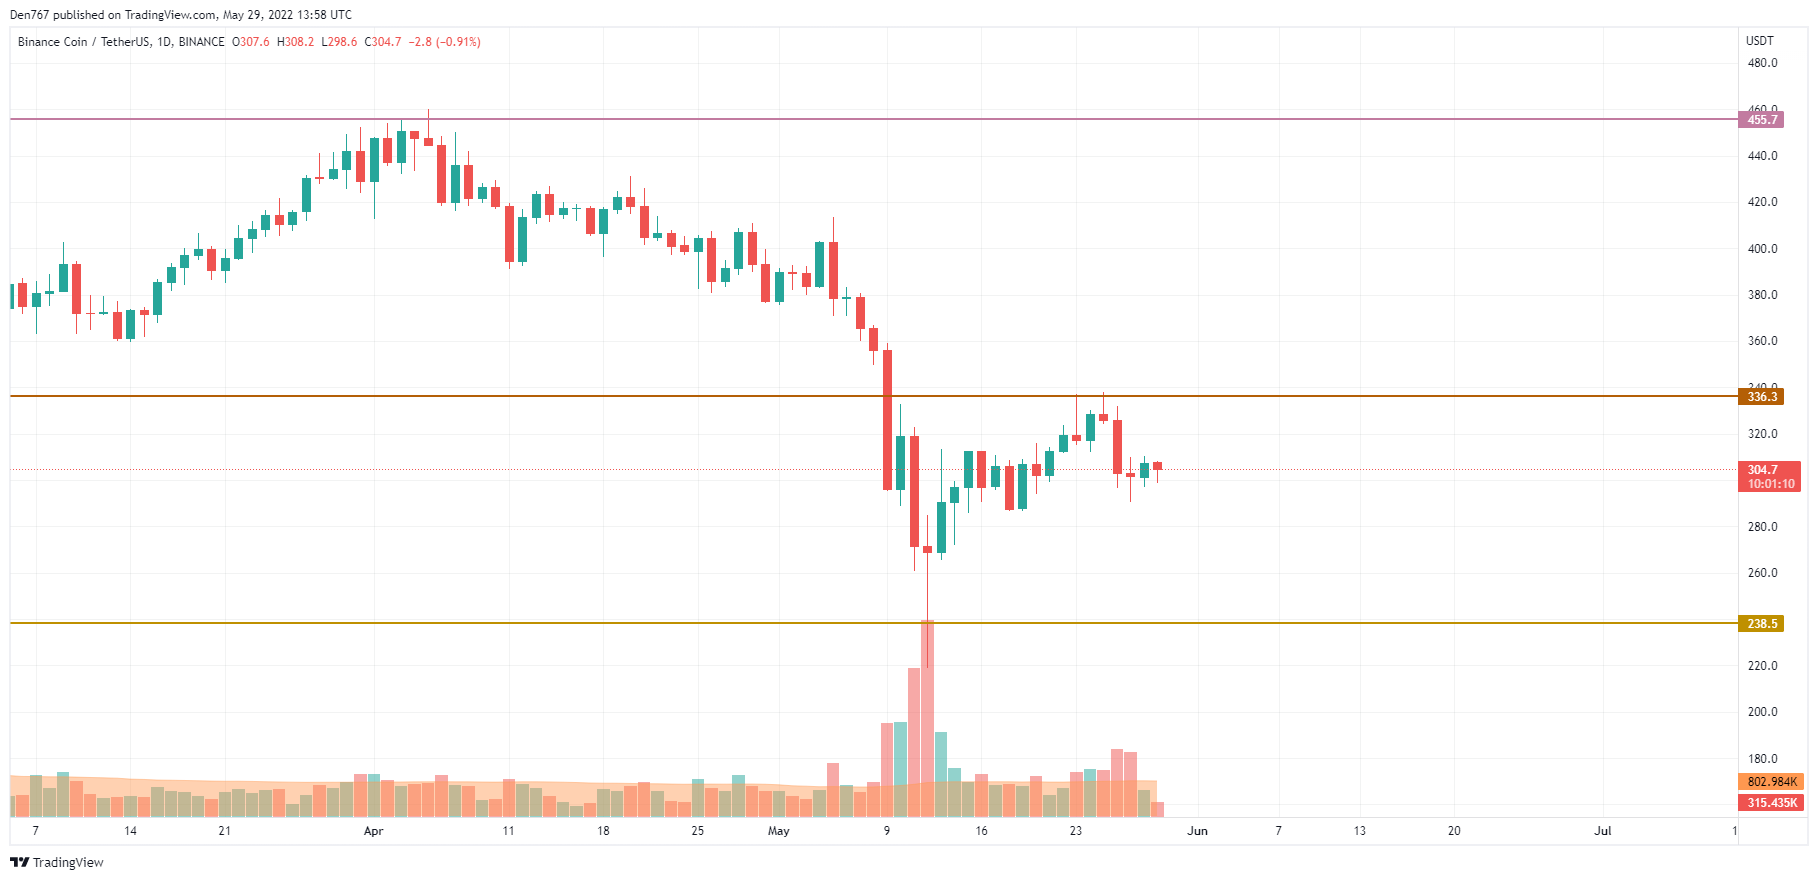
BNB/USD chart by TradingView
On the daily time frame, the native exchange coin has returned above the important $300 mark. Thus, the rate is not far away from the resistance, which means that there is a possibility to see a rise to the $336 level soon.
BNB is trading at $304.8 at press time.
ADA/USD
Cardano (ADA) is the biggest loser from the list in terms of weekly change with a drop of 12%.
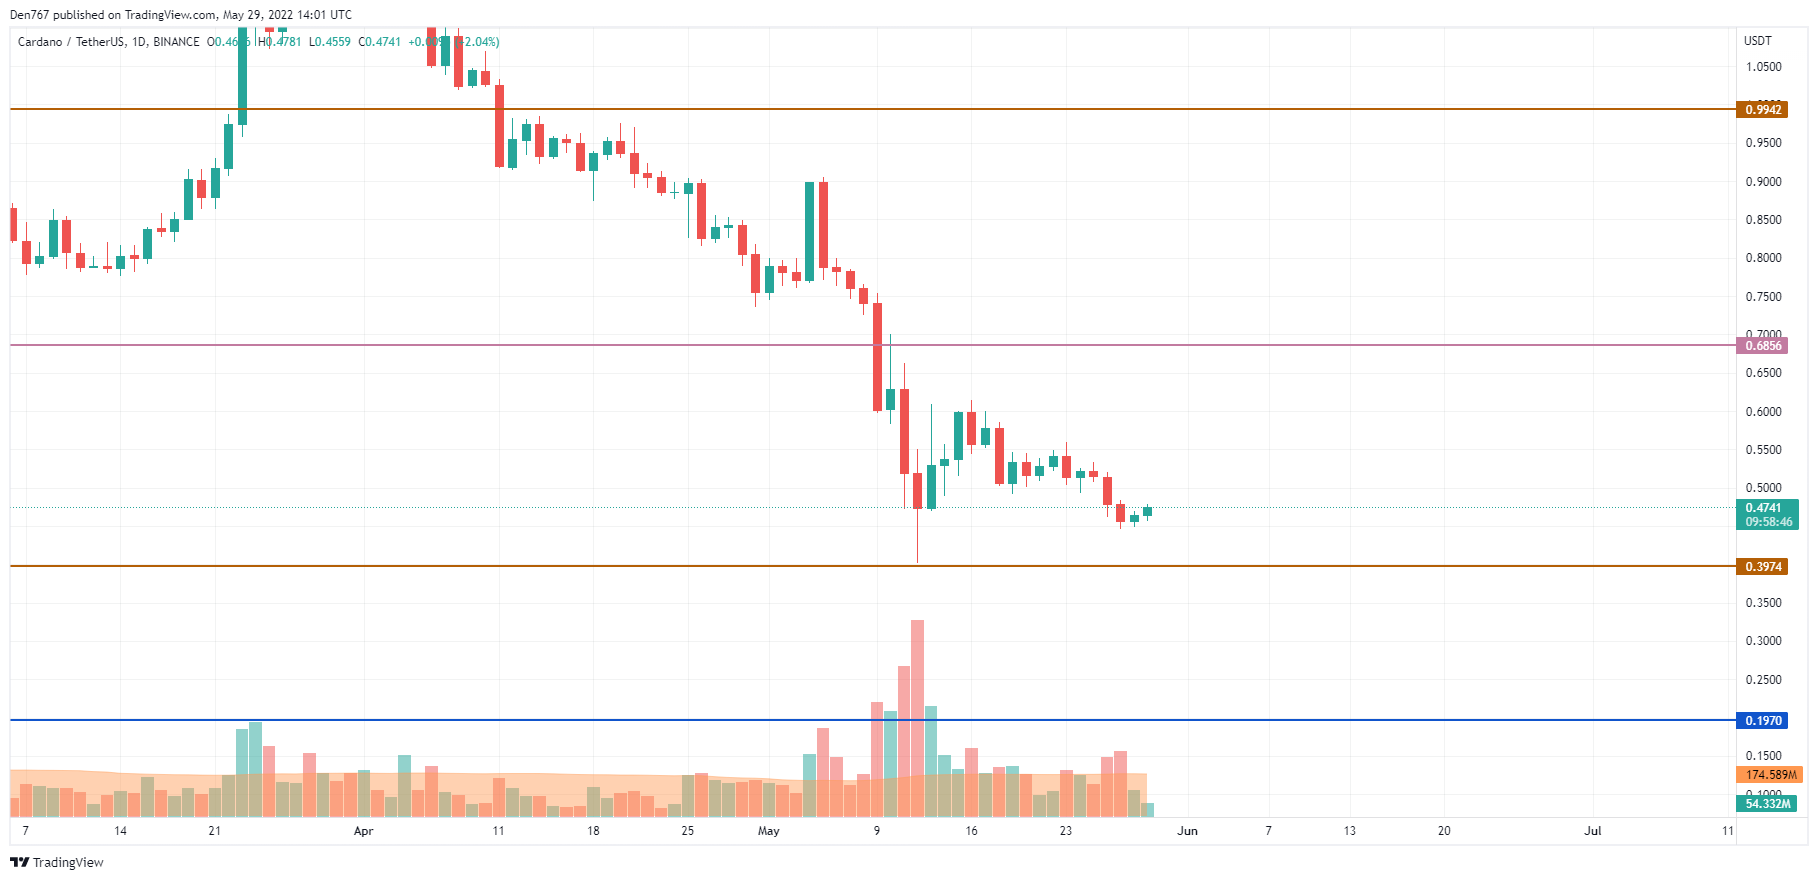
ADA/USD chart by Trading View
Unlike other coins, Cardano (ADA) remains bearish as the bulls could not return the rate to the $0.50 mark. Respectively, until the price is below it, there are more chances to see a further decrease to the support at $0.3974 than a bounceback.
ADA is trading at $0.4740 at press time.
TRX/USD
TRX is the only coin located in the green zone as the growth has constituted 7% over the previous week.
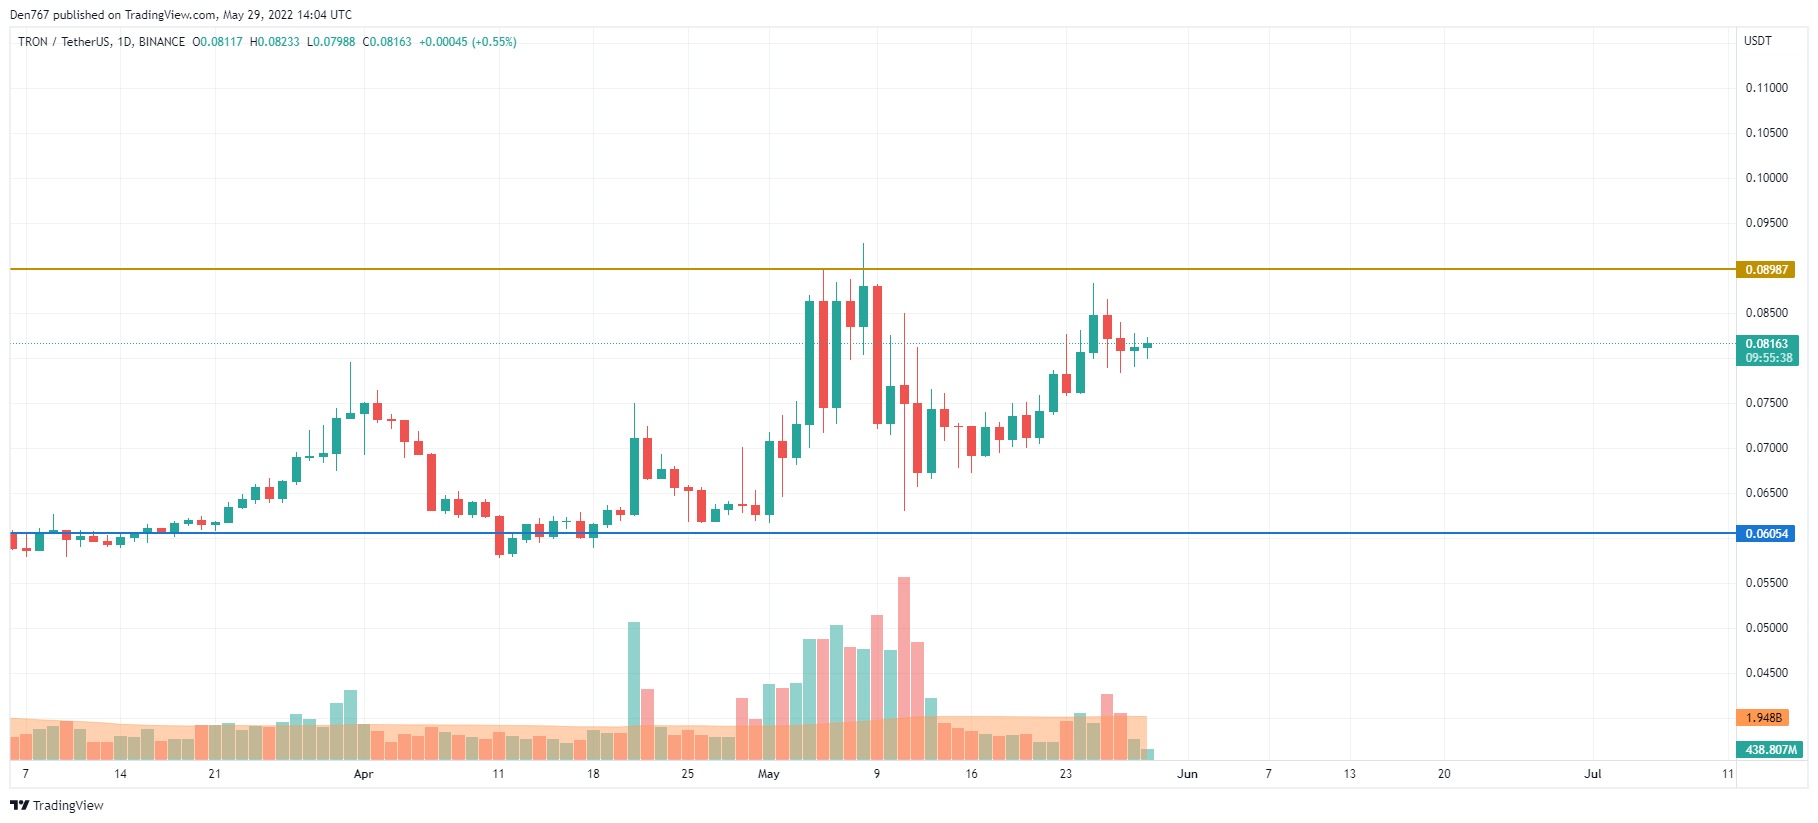
TRX/USD chart by TradingView
Despite the rise, TRX has not accumulated enough power for a continued rise based on the low volume. However, if the upward move continues to the $0.085 mark, there is chance to see the retest of the $0.08987 resistance shortly.
TRX is trading at $0.08155 at press time.
Read full original article on U.Today
Author

Denys Serhiichuk
U.Today
With more than 5 years of trading, Denys has a deep knowledge of both technical and fundamental market analysis.


