Here’s where the most prominent technical analysts plan to buy the Bitcoin dip
- The cryptocurrency market suffered a steep correction in the past 24 hours.
- Close to 200,000 traders got liquidated, losing nearly $2 billion, according to recent reports.

The cryptocurrency market's total market capitalization hit $581 billion on November 25 for the first time since January 2018. Unfortunately, the latest crash wiped around $92 billion in just hours.
Statistics from Bybt show that around $2.04 billion has been liquidated in the past 24 hours. However, now that volatility seems to be calming down, several popular analysts are getting ready to place their buy orders to buy the dip.
What is the consensus of the most prominent analysts in the crypto market?
Veteran trader Peter Brandt exited a significant portion of his Bitcoin position on November 21 as his price target was hit. Brandt explains that Bitcoin has been able to trade significantly above the 18-SMA on the daily chart since the last rally on October 8. Currently, Bitcoin price is just standing around this SMA, which could be a potential price target to start buying.
The market has remained strongly above that trend model, that's characteristic of a market that is going up on bids, that the aggressive wing of this market is the buyers; they are not chasing, they are simply gobbling up any offer that comes in.
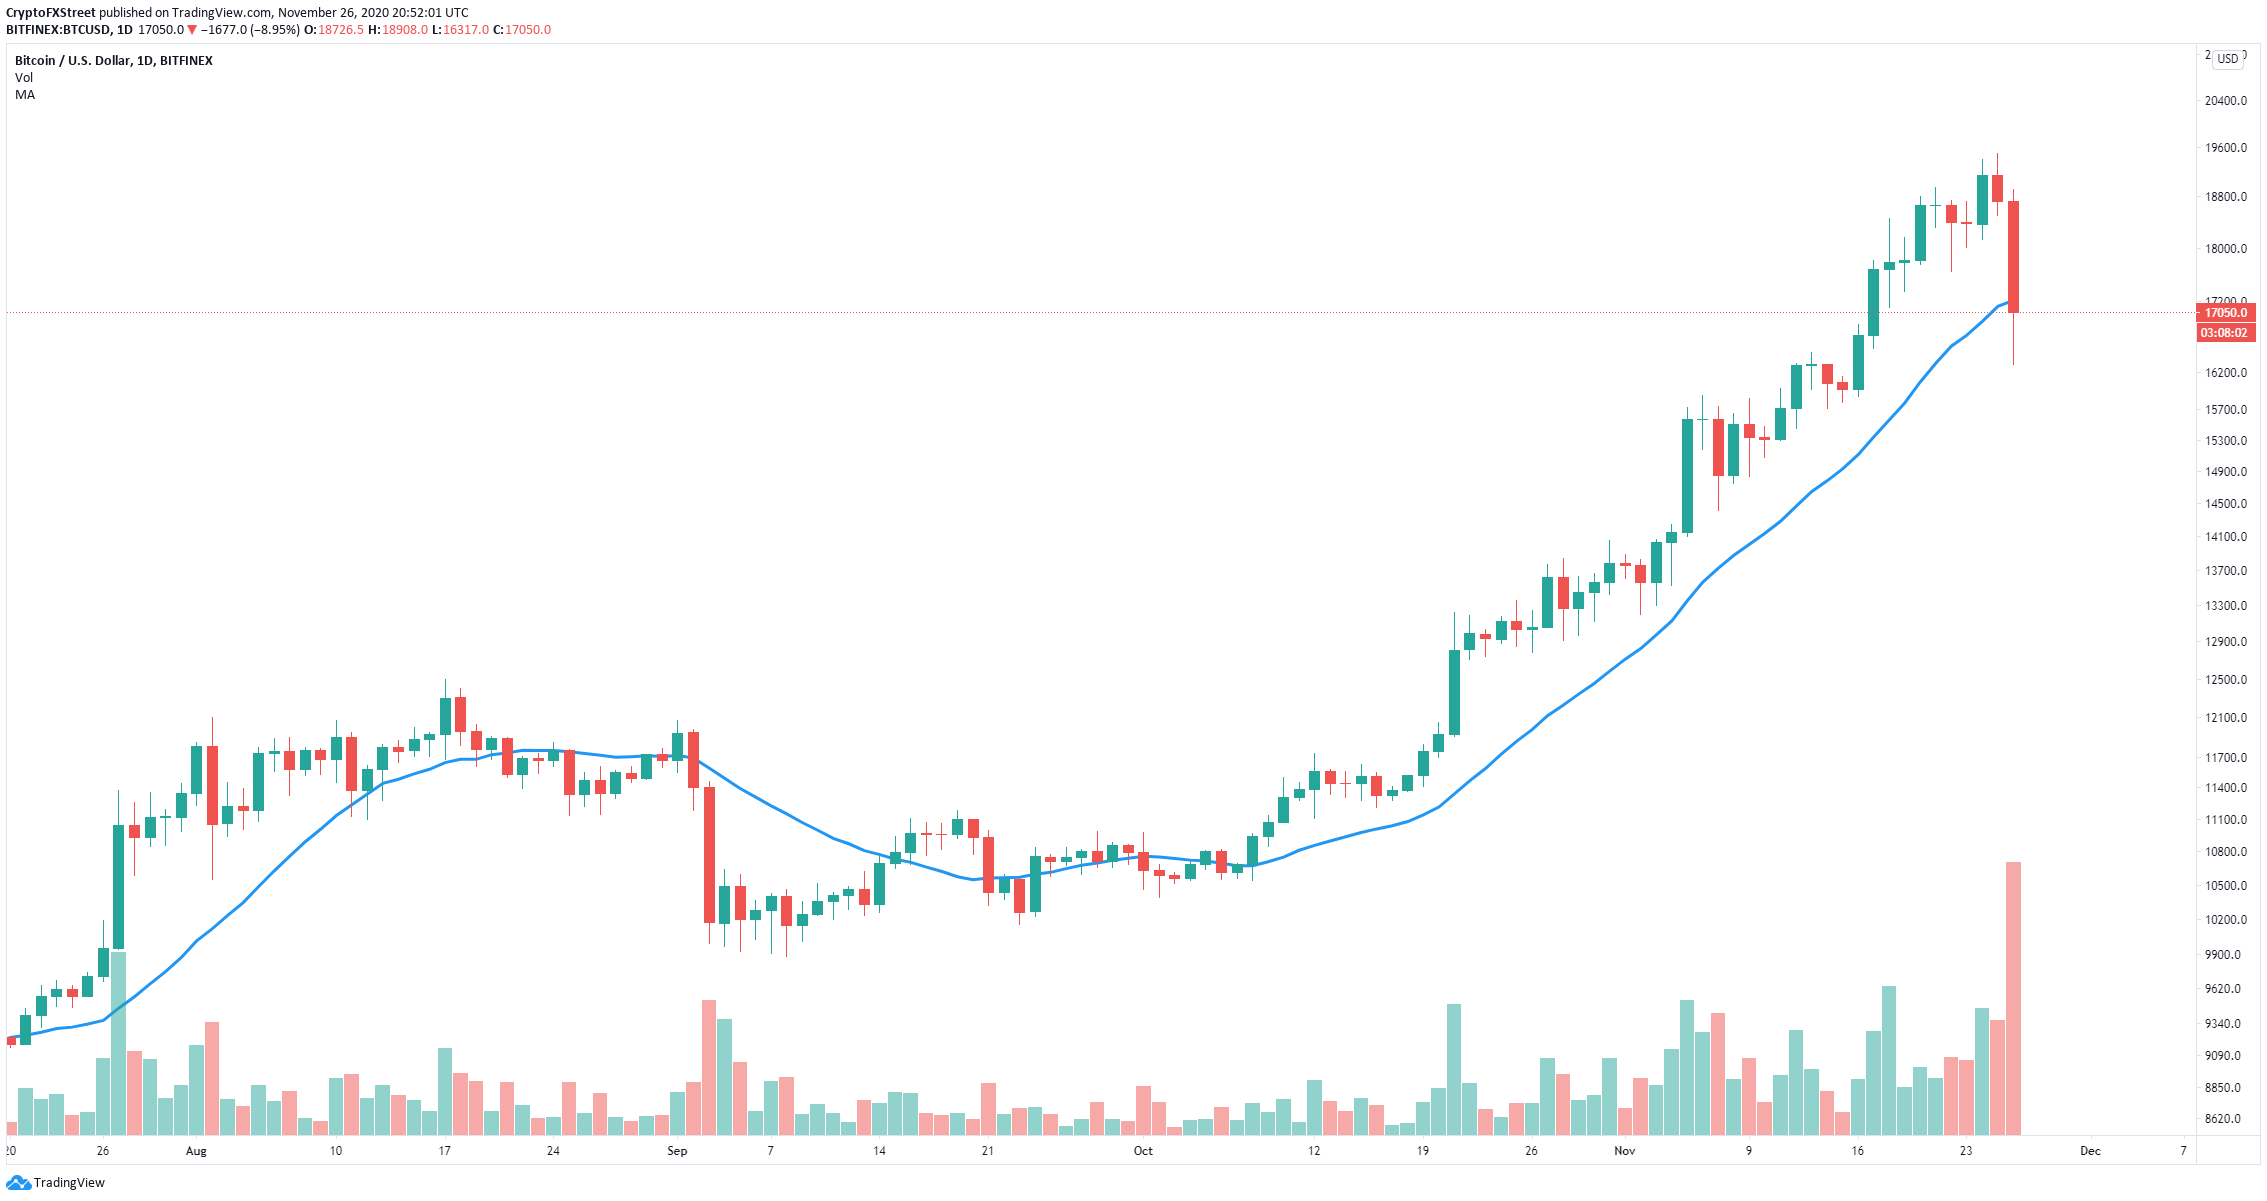
BTC/USD daily chart
Peter has been watching a large symmetrical triangle pattern formed on the weekly chart from which Bitcoin has broken out on October 19. Brandt believes $56,000 is a potential price target in the long-term. It's important to note that Brandt also talks about previous corrections that averaged around 34%, which would put Bitcoin at approximately $12,750 from this last high.
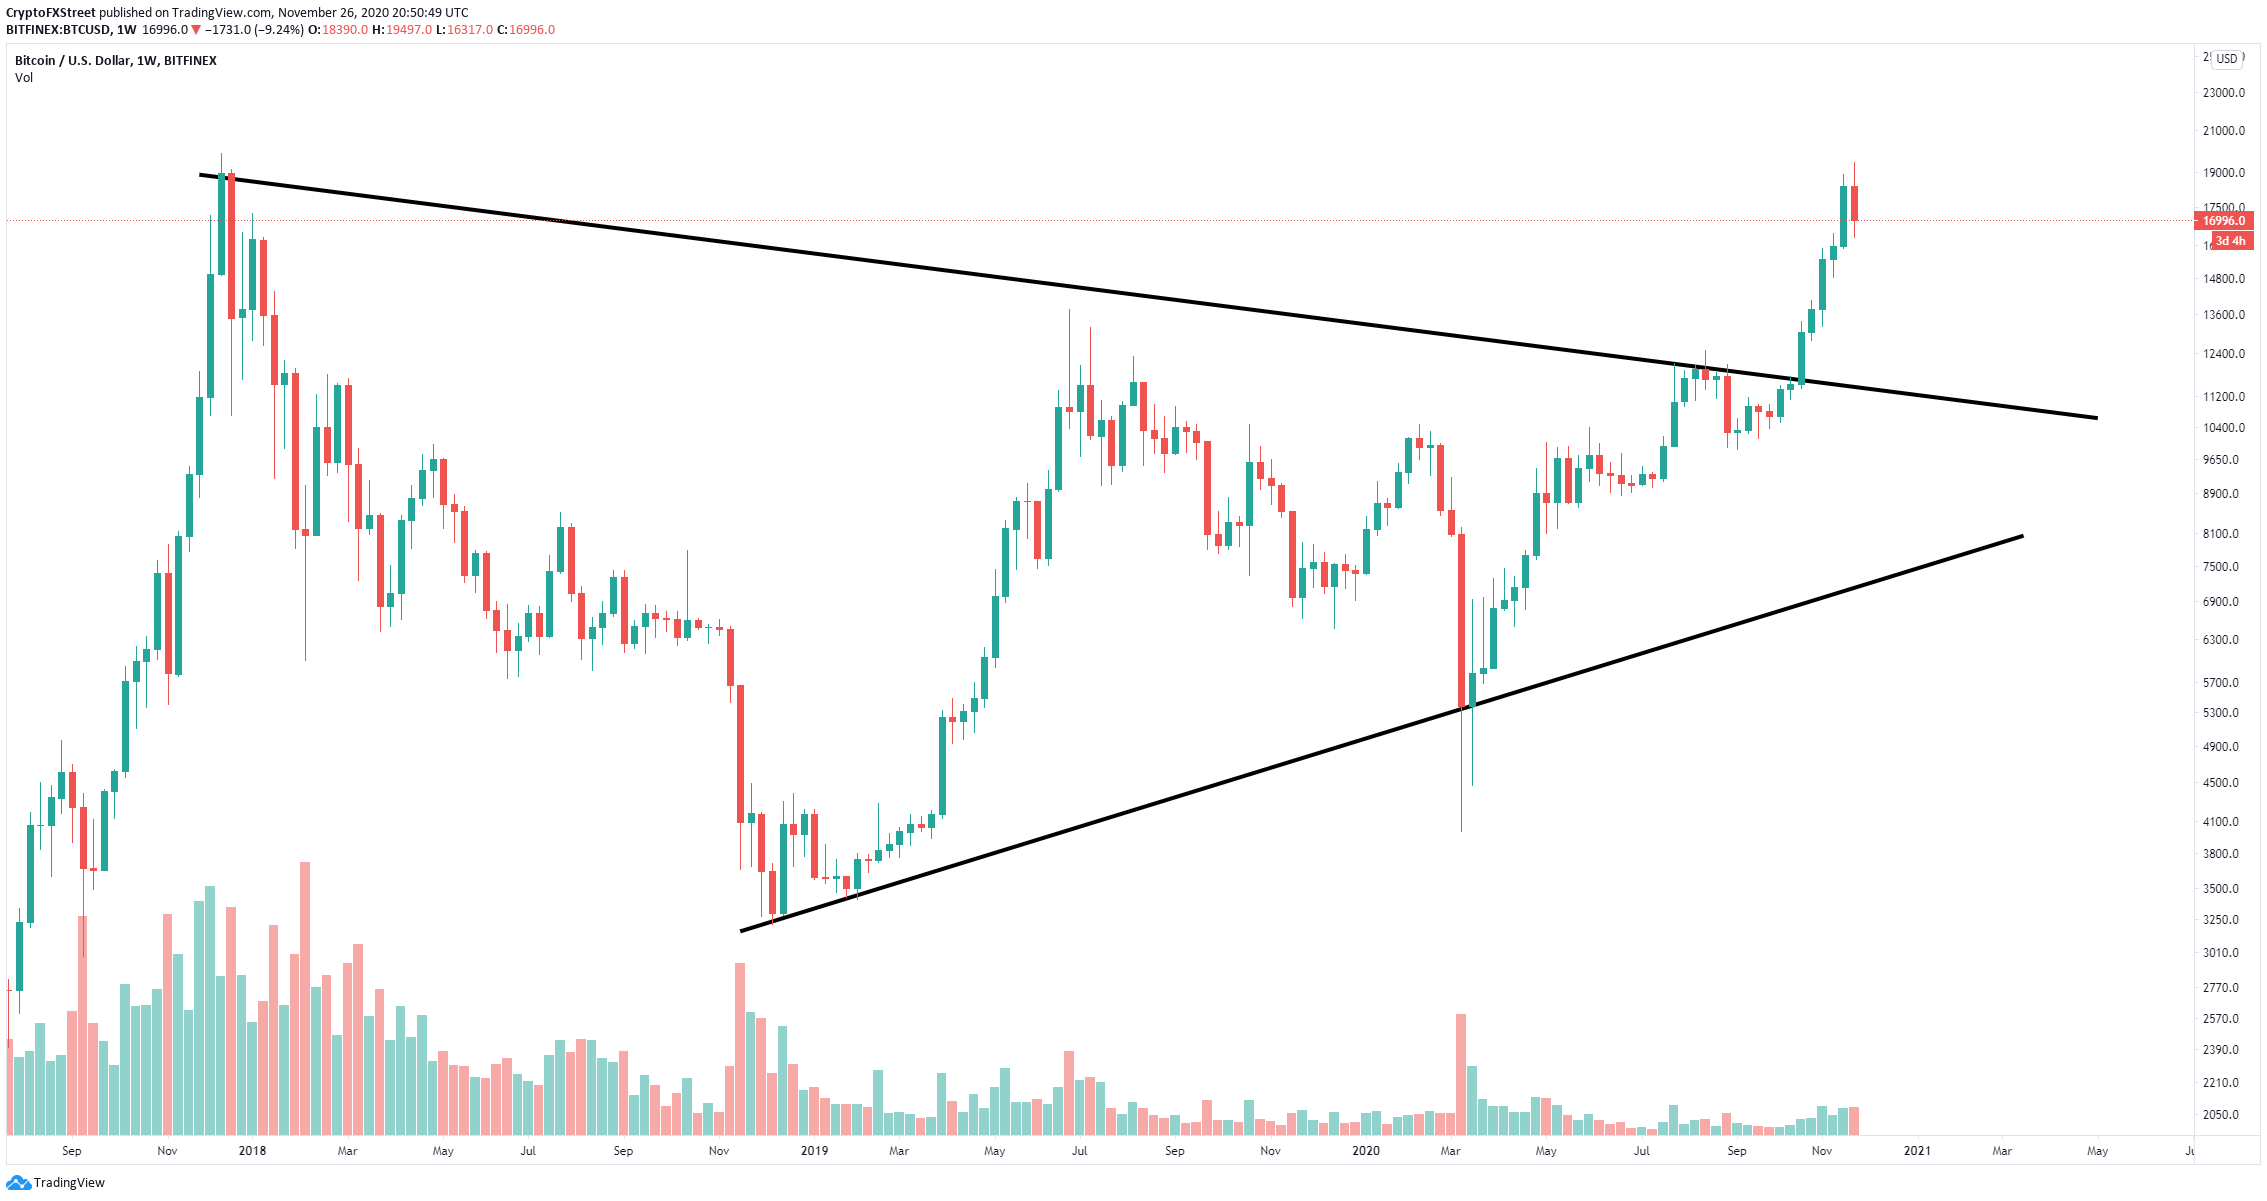
BTC/USD weekly chart
Davinci Jeremie, a famous Bitcoin analyst on Youtube, seems to believe that Bitcoin could be on its way to a dead cat bounce. Jeremie warns traders not to be surprised if BTC heads up towards $18,300 again, which is the 0.618 Fib level before a final 30% retrace towards $13,000.
Anything could happen, of course, the institutions could go: Oh I'm FOMOing in and then just overFOMO, you just don't know.
Other potential indicators of when to buy the dip
Philip Swift, a cryptocurrency investor and co-founder of Decentrader, utilizes the Golden Ratio Multiplier to find out potential tops and bottoms. It seems that Bitcoin got rejected from the 350DMA x 2, and it's bouncing off the 350DMA x 1.6.
1/ Golden Ratio Multiplier update:
— Philip Swift (@PositiveCrypto) November 26, 2020
Boom! Price firmly rejected by the 350dma x 2 yesterday when CT seemed certain we would race through it.
This indicator is very much in play this cycle. pic.twitter.com/rFc5zEgb9T
The Golden Ratio system relies on the way Bitcoin is being adopted by society rather than just price action like in the stock market. According to the creator, this method can accurately predict Bitcoin price cycles in the long-term:
It will demonstrate that Bitcoin's adoption is not only following a broad growth curve but appears to be following established mathematical structures.
Bitcoin with new (third) daily DeMark Sequential sell Countdown 13 however we've been more focused on the weekly time period with new Combo sell Countdown 13 and Sequential on week 12 of 13. Potential pullback levels on chart pic.twitter.com/1pDcamgq30
— Thomas Thornton (@TommyThornton) November 25, 2020
Other analysts like Thomas Thornton are using the TD Sequential indicator, which flashed a sell signal on Bitcoin's weekly chart this week. According to Thornton, there is a potential bearish price target of around $12,000 at the 0.618 Fib level.
It certainly seems that the consensus of a potential bottom and price target for Bitcoin bears is $13,000. Several analysts using quite a variety of systems and methods have determined more or less the same potential target.
However, it's also entirely possible for Bitcoin to continue bouncing off the latest low level of $16,317 towards the high at $19,497 and break the all-time high around $20,000, which would completely invalidate all the bearish outlooks.
Author

Lorenzo Stroe
Independent Analyst
Lorenzo is an experienced Technical Analyst and Content Writer who has been working in the cryptocurrency industry since 2012. He also has a passion for trading.




