Have bulls accumulated enough power to return Bitcoin (BTC) to $11,000?


Cover image via www.tradingview.com
Monday has begun with a continued positive mood on the cryptocurrency market. Chainlink (LINK) and Litecoin (LTC) are the only exceptions to the rule, in which rates have gone down by 0.75% and 0.83% respectively.

In terms of the dominance rate of Bitcoin (BTC), its index is almost unchanged since yesterday and now stands at 54.5%.

The relevant data of Bitcoin for today:
-
Name: Bitcoin
-
Ticker: BTC
-
Market Cap: $194,643,790,856
-
Price: $10,527.51
-
Volume (24h): $92,650,904,372
-
Change (24h): 2.22%
The data is relevant at press time.
BTC/USD: Can bulls fix above $10,500 this week?
Over the past weekend, buyers were able to break through the resistance of $10,500 and renew the weekly high. The growth took place at low volumes, and the pair was unable to test the level of $10,600.
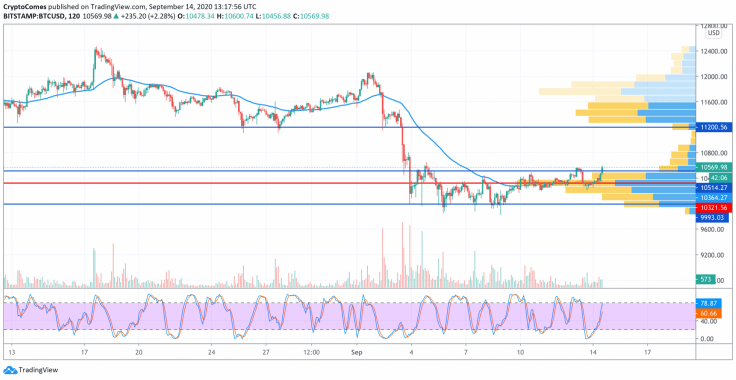
Sellers responded to this rally with a wave of selling that pushed the Bitcoin (BTC) price back below the two-hour EMA55. Last night, the decline stalled at the support area of $10,200 and buyers tried to gain a foothold in the mid-price area to repeat the breakout of $10,500.
To retest the target level of $10,800, it will be necessary to form a bullish impulse with volumes exceeding the average level. If the activity of buyers is low, then bears will intensify the onslaught and the pair may return to the area of $10,000. At the beginning of this week, the price of BTC will test the support of $9,800.
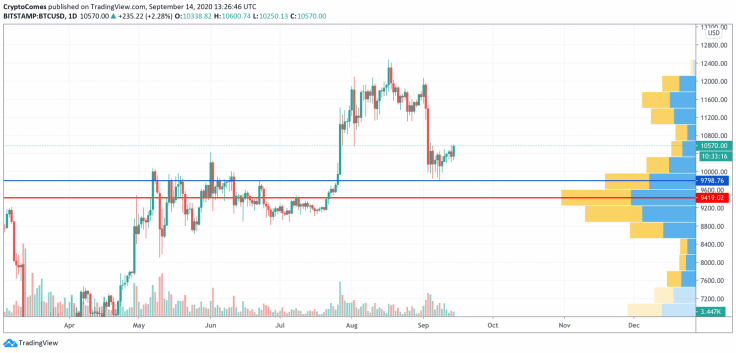
On the daily time frame, buyers still lack the power to return to previous peaks as the trading volume remains low. What's more, liquidity is also not high enough to see growth. For this reason, traders may expect an ongoing drop to below $10,000—around $9,800 to gain liquidity for a further rise.
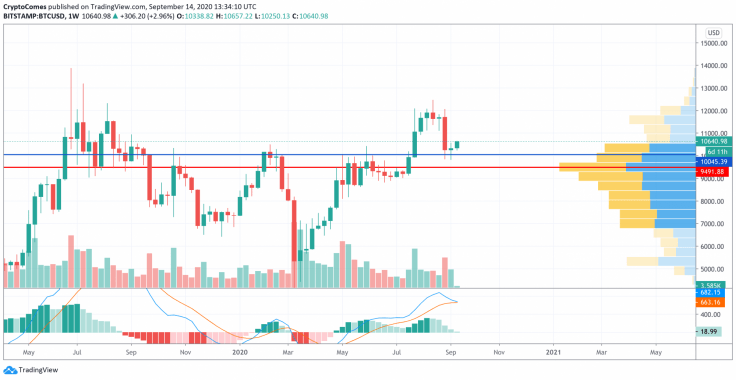
On the weekly time frame, nothing crucial has changed so far. A more profound decline remains the most likely scenario. It is confirmed by the MACD indicator, about to enter the short zone, as well as the declining trading volume. In case the situation remains the same, Bitcoin (BTC) may retest the $10,000 mark.
Bitcoin is trading at $10,623 at press time.
Read full original article on U.Today
Author

Denys Serhiichuk
U.Today
With more than 5 years of trading, Denys has a deep knowledge of both technical and fundamental market analysis.


