Has TRX accumulated enough power for the mid-term bullish trend?

On the last day of the week, bulls have seized the initiative as all of the top 10 coins are in the green zone.
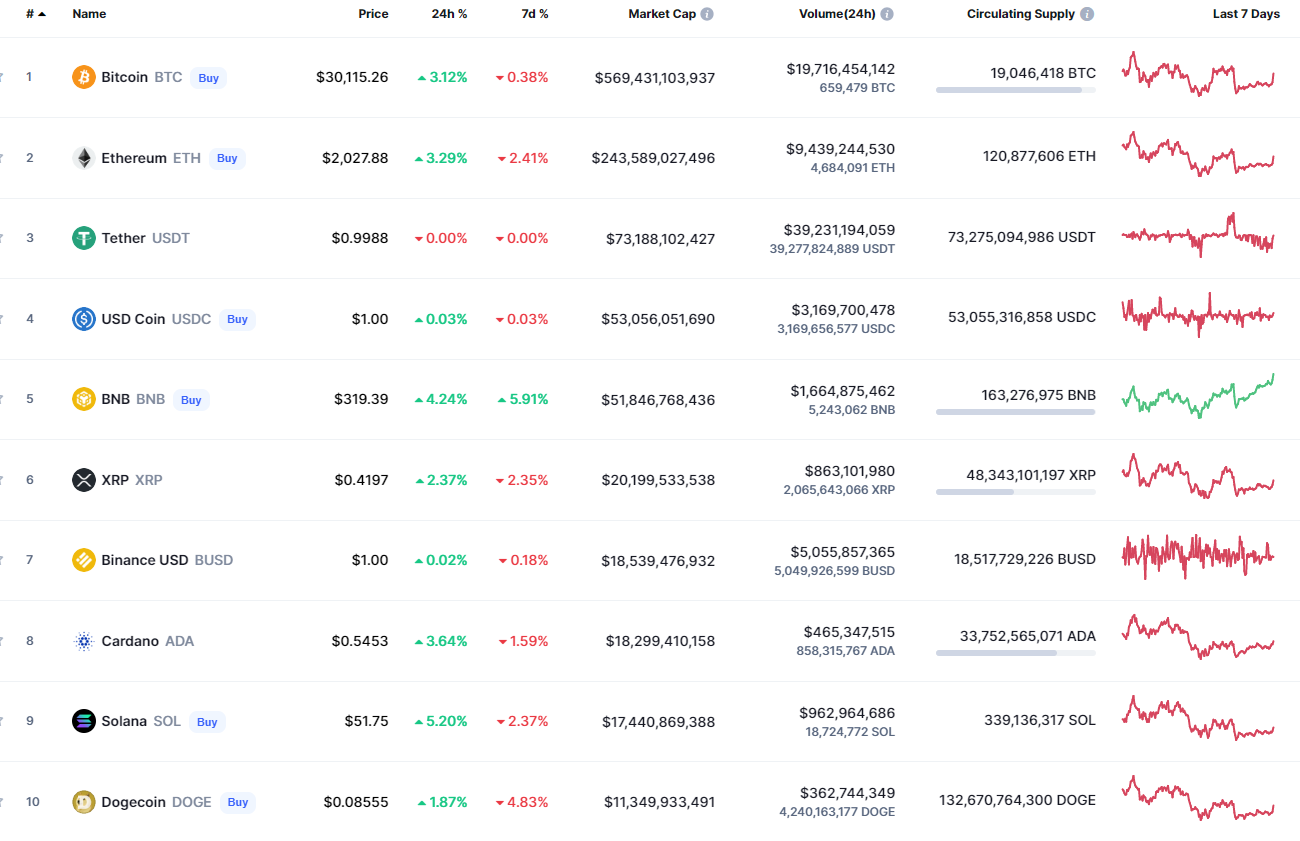
Top coins by CoinMarketCap
TRX/USD
TRX has followed the bounceback of other coins, rising by 4.66% over the last 24 hours.
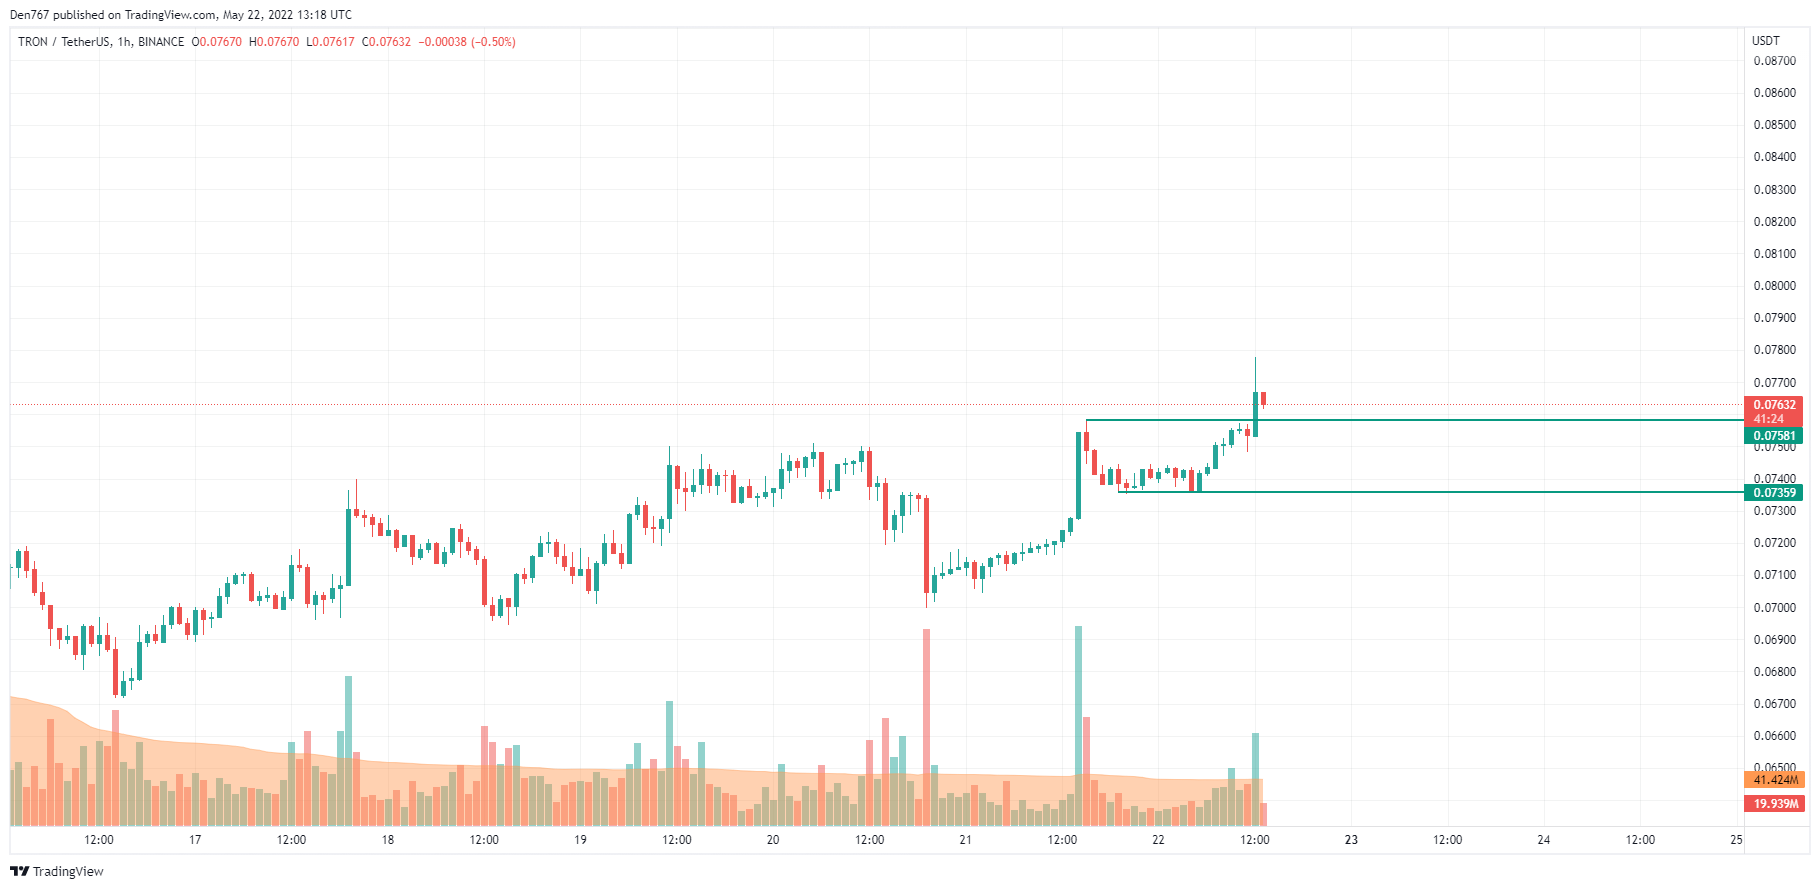
TRX/USD chart by TradingView
On the local time frame, TRX has broken the resistance and is trying to fix above it. If bulls can do that by the end of the day, the impulse can continue to the zone around $0.08 soon.
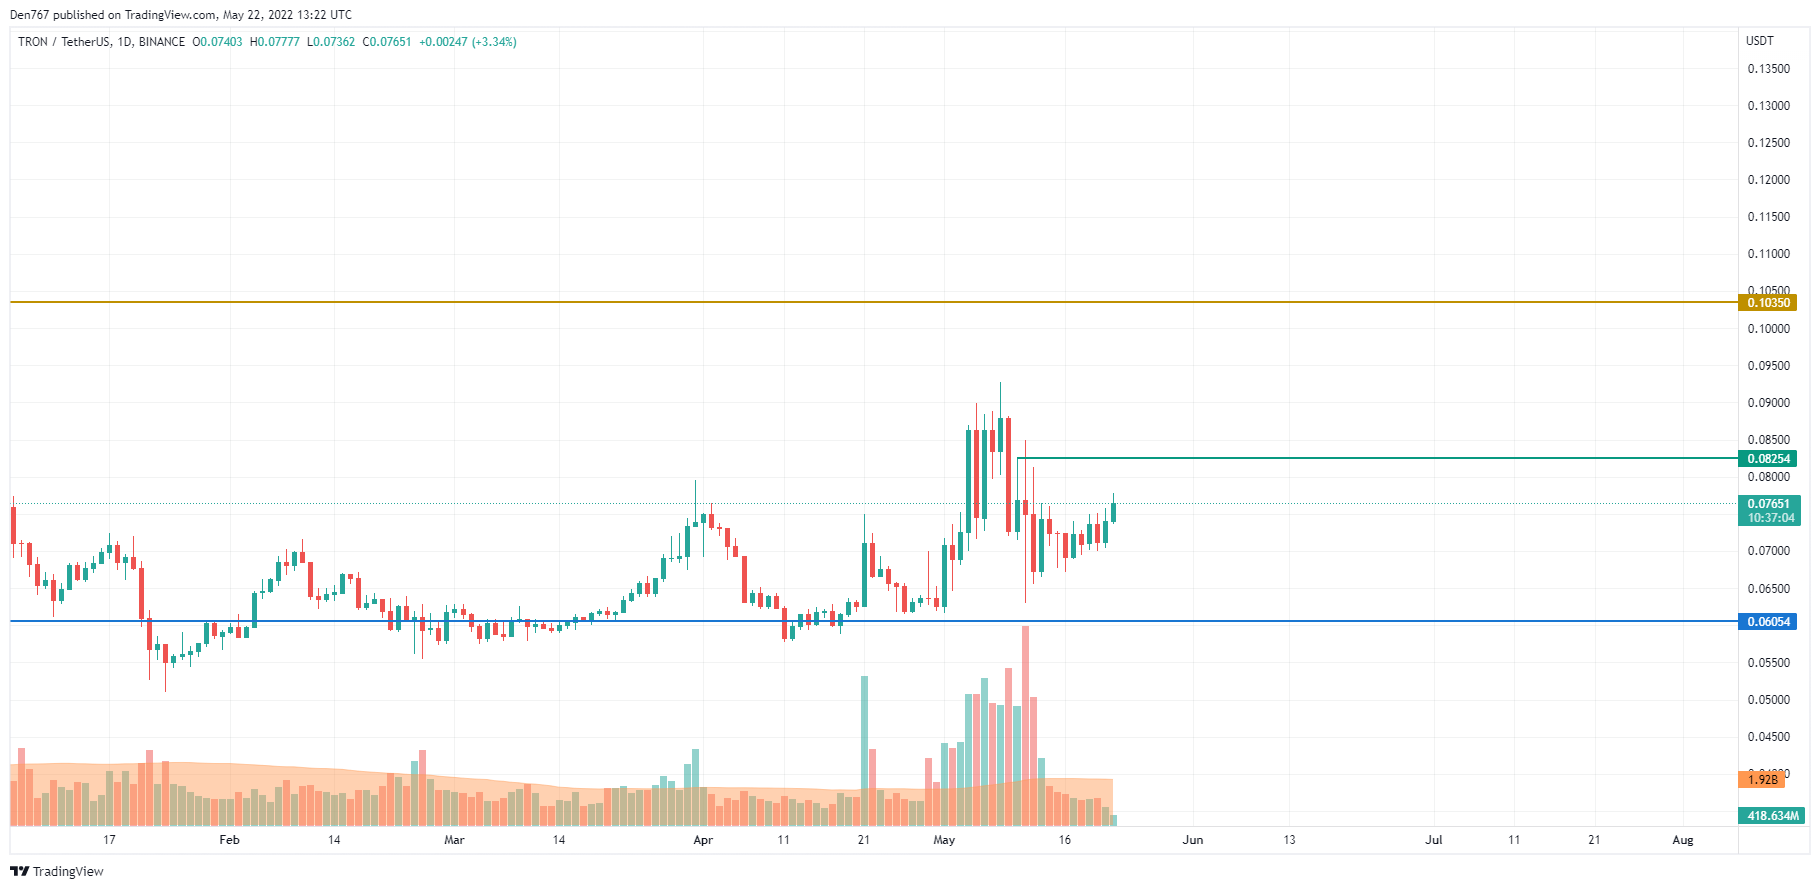
TRX/USD chart by TradingView
On the daily chart, TRX is about to start rising after an accumulation phase. If the buying trading volume goes up, there is a high chance to see the test of the interim level at $0.08254 next week.
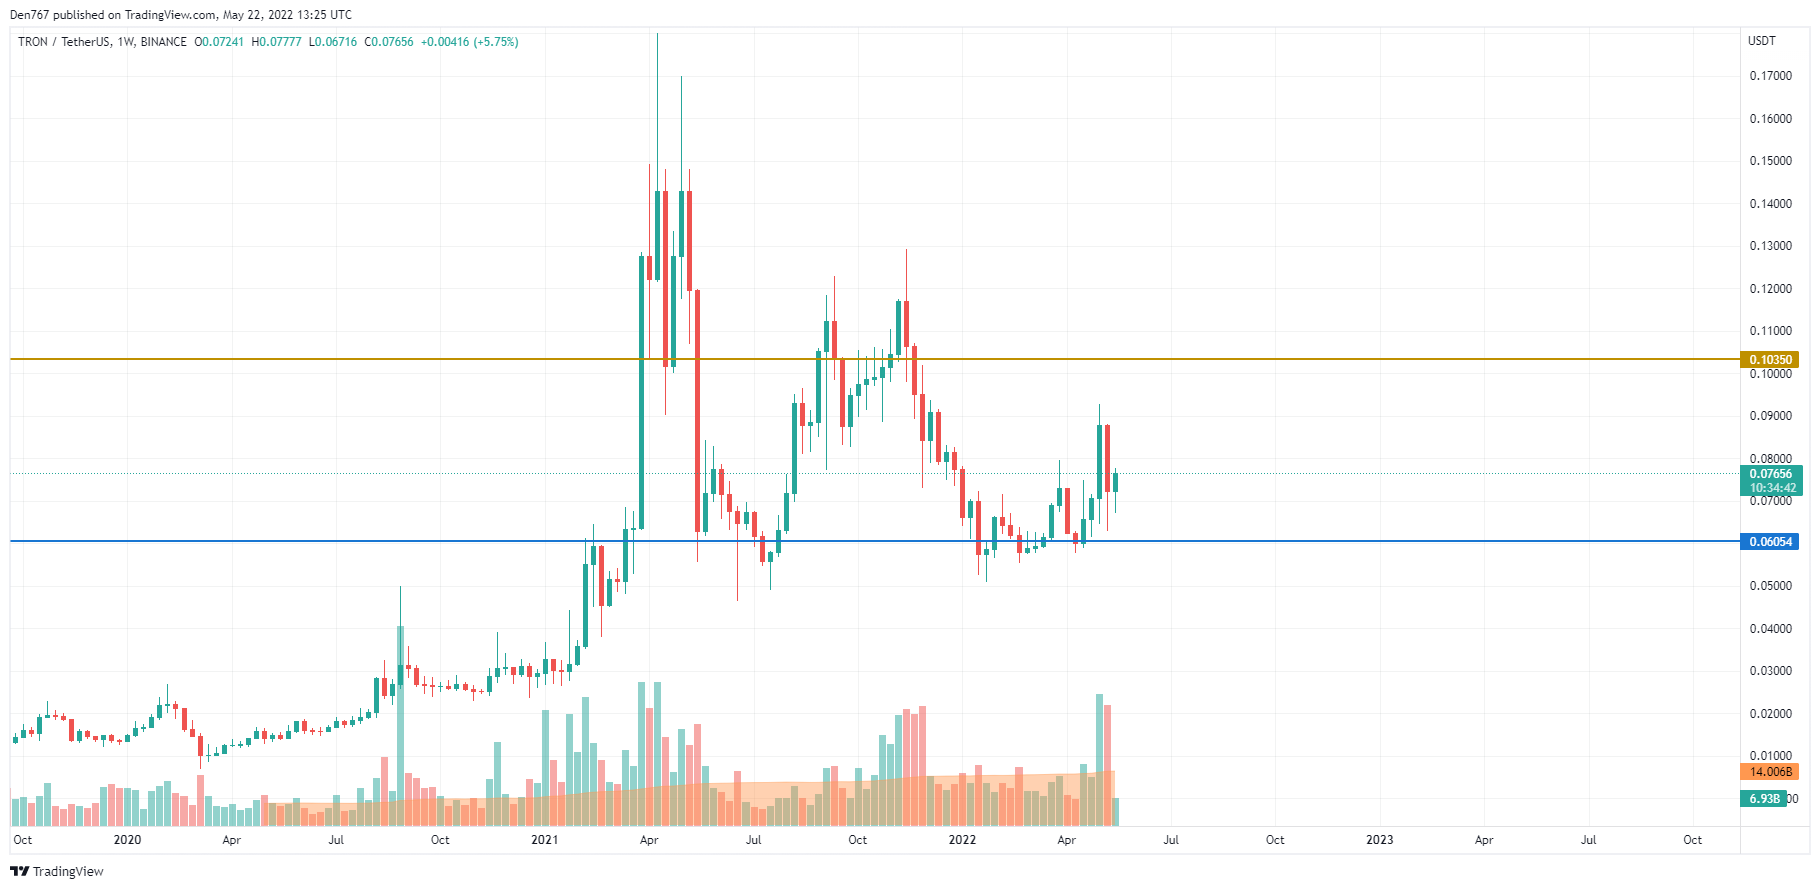
TRX/USD chart by TradingView
From the mid-term perspective, TRX is neither bullish nor bearish as the rate is far away from its crucial levels. In this case, the altcoin needs more time to accumulate power before a sharp move.
In this case, sideways trading in the range of $0.07-$0.08 is the more likely scenario for the upcoming weeks.
TRX is trading at $0.07648 at press time.
Read full original article on U.Today
Author

Denys Serhiichuk
U.Today
With more than 5 years of trading, Denys has a deep knowledge of both technical and fundamental market analysis.


