Four signs the Bitcoin price rally could top out at $26K for now

Bitcoin (BTC) received a substantial boost this week as United States inflation levels for February were in line with market expectations. On March 14, the BTC/USD pair surged to a 2023 peak at $26,550 after the news.
But, while the macroeconomic conditions may currently favor risk-on buyers, certain on-chain and market indicators hint at a potential correction in the near term.
BTC flows back to exchanges as price rises
On March 13, Glassnode’s exchange flow data recorded the most significant inflow to exchanges since May 2022. This means more supply on exchanges and potentially higher selling pressure.
The coin days destroyed indicator, which measures the time-weighted transfers of Bitcoin, also shows a small spike, indicating that old hands are moving coins. The indicators might signal profit booking by long-term holders, which can lead to a correction.
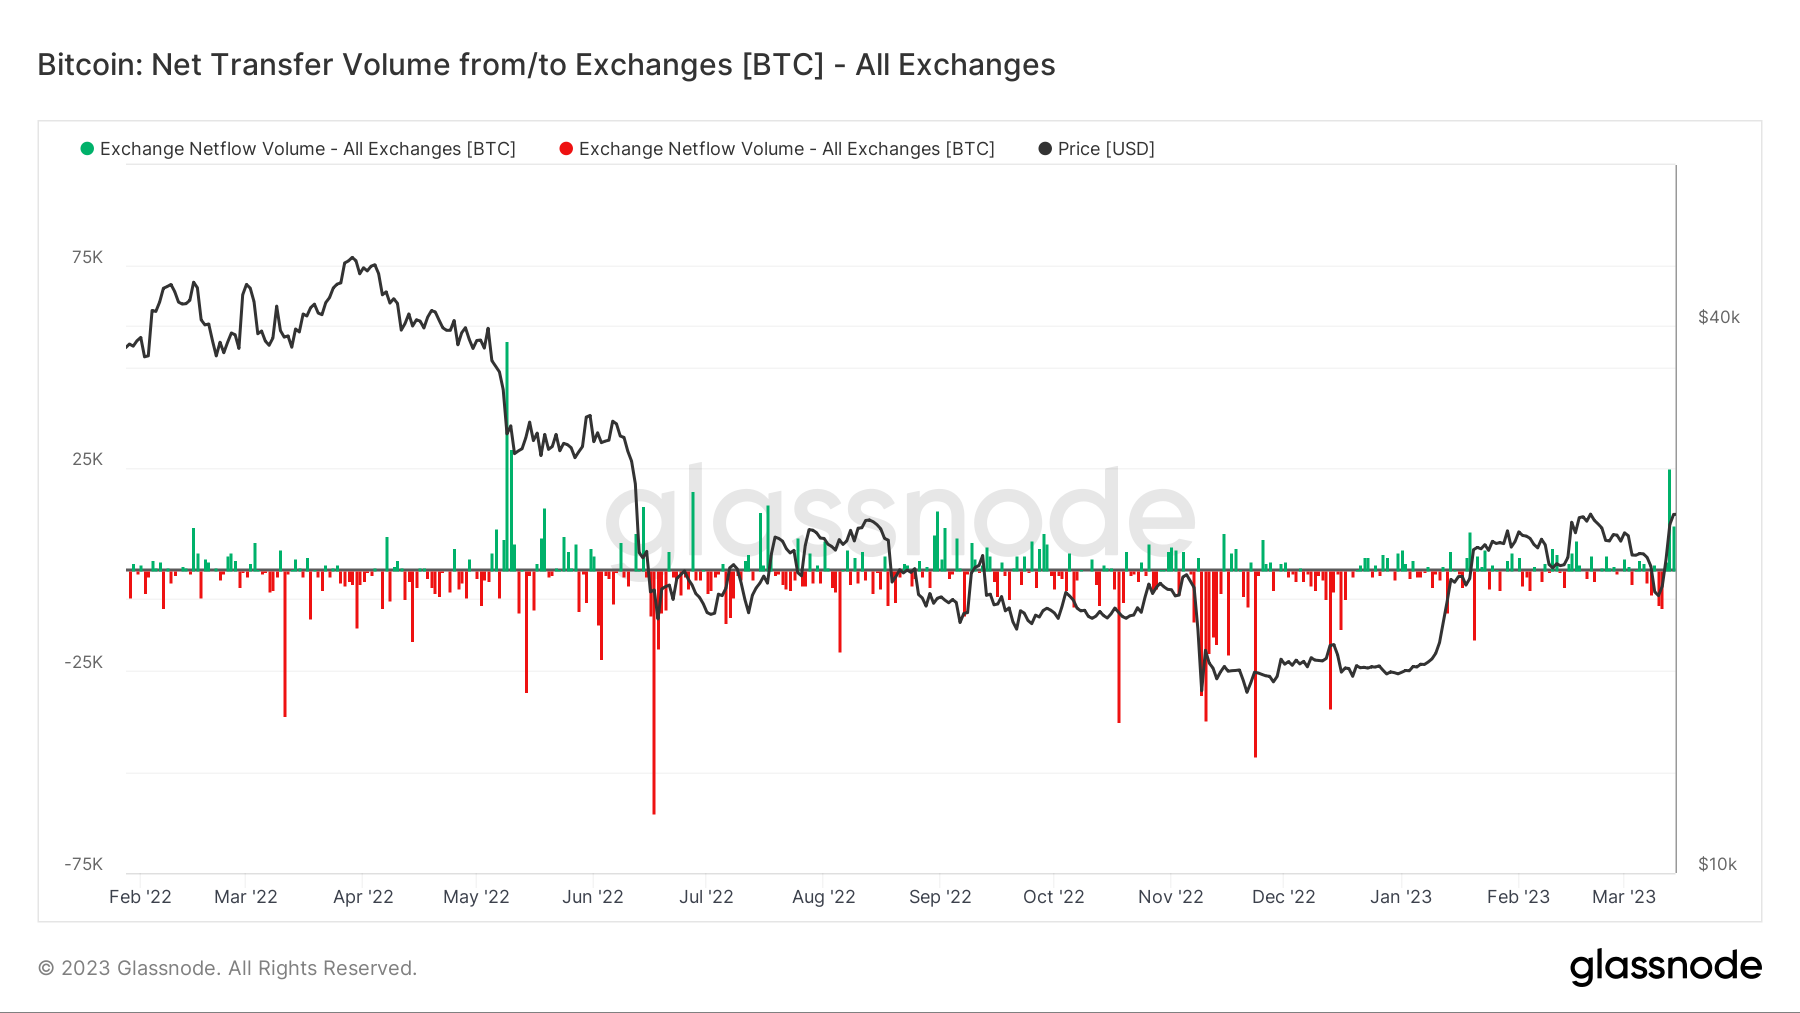
Bitcoin exchange netflow volume. Source: Glassnode
Bitcoin funding rates, RSI jump
Moreover, the funding rate for Bitcoin perpetual swaps is also elevated with the latest Consumer Price Index print. In other words, more traders are betting on the upside with leveraged positions, increasing the risk of a correction.
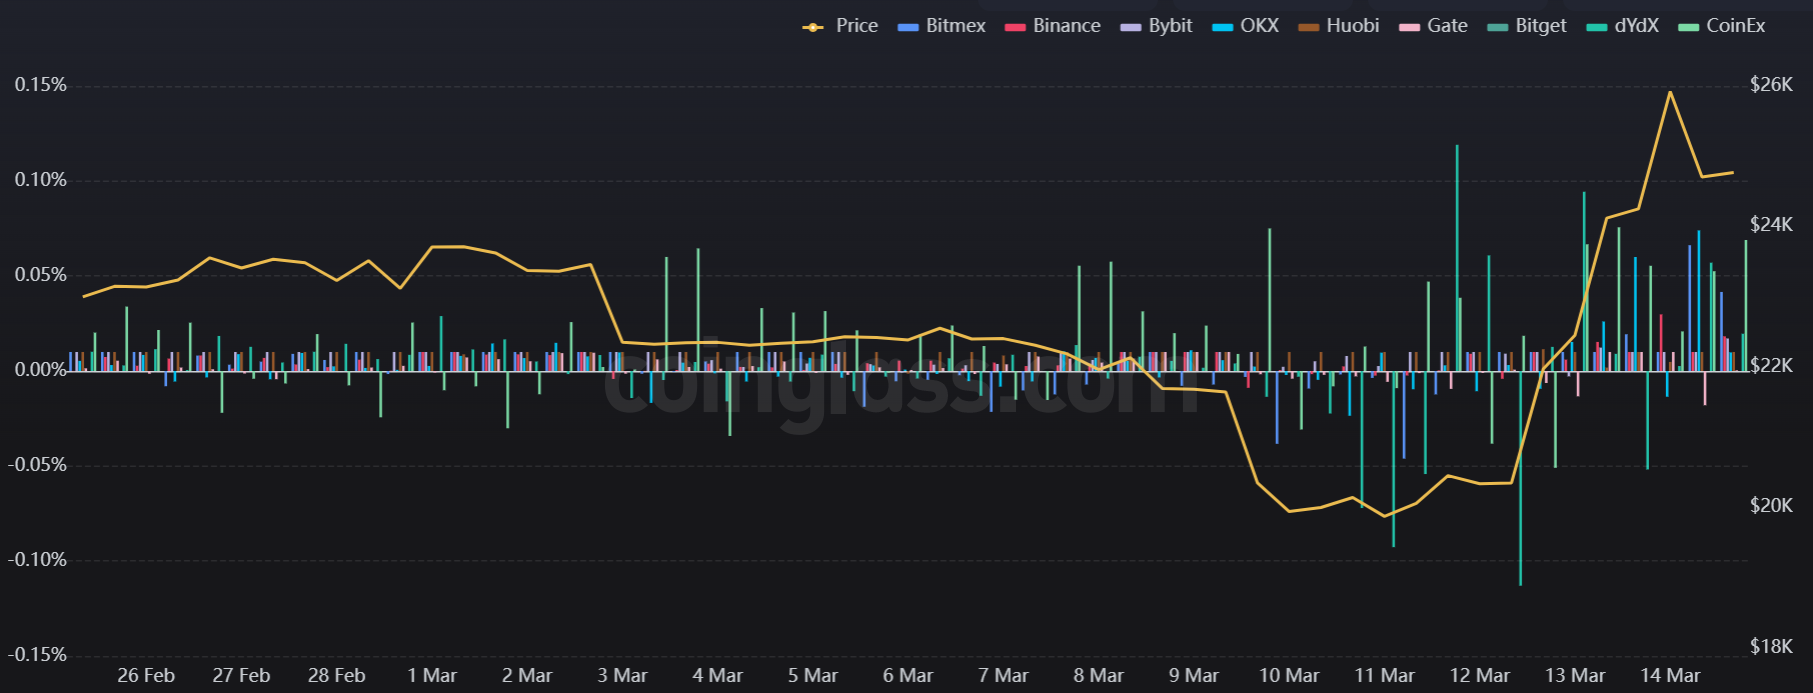
Funding rate for Bitcoin perpetual contracts. Source: Coinglass
The sharp price movement has also recorded a significant spike in the Relative Strength Index (RSI), a technical momentum indicator, with a reading of as high as 82. This means that BTC/USD is generally considered “overbought” in the short term.
BTC vs. USD painting a bearish pattern
BTC price is currently forming a broadening wedge pattern, which depicts the heightened level of volatility. Both buyers and sellers are pushing the price beyond support and resistance levels, with the reversals coming quickly.
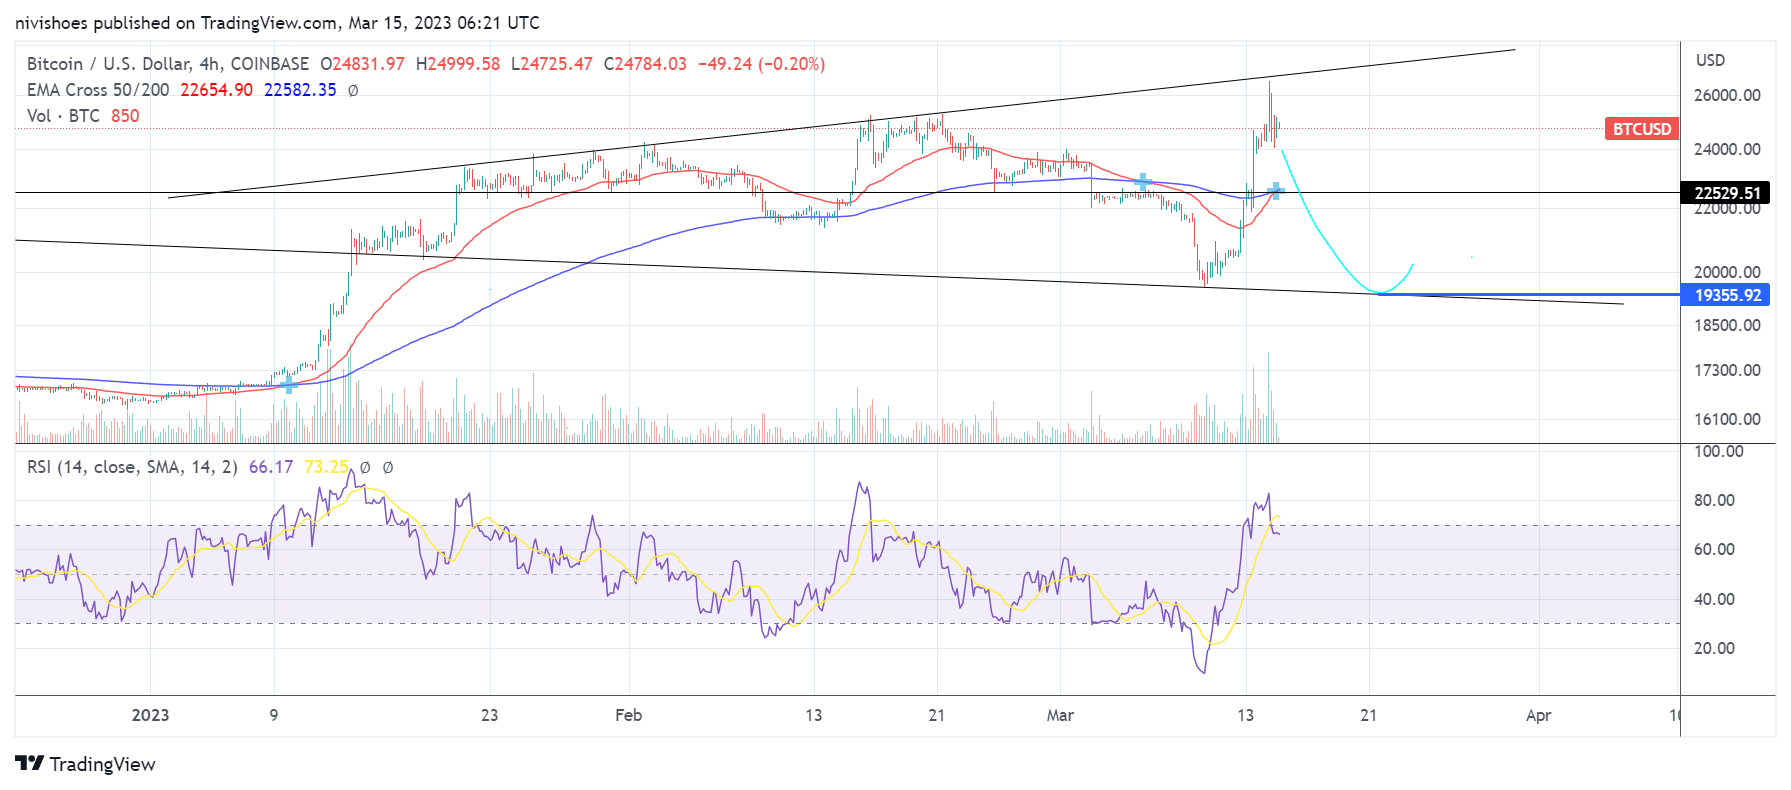
BTC/USD 4-hour price chart. Source: TradingView
Buyers failed to stage a pattern breakout on March 14, and are now facing resistance at its ceiling of $26,700. At the same time, there is a chance that the price will correct back toward the bottom of the pattern, around $19,500, in the coming days.
On the contrary, if Bitcoin’s price breaks above the top trendline, the bulls will likely pile in to push the price toward $30,000. There are potentially welcome signs for the bulls that this could happen — namely in the BTC options and futures markets.
As Cointelegraph reported, there’s still room to run, as the indicators have yet to reach previous peak levels.
Author

Cointelegraph Team
Cointelegraph
We are privileged enough to work with the best and brightest in Bitcoin.


