Fantom price says “give it time” as bears have pushed past historical support level
- Fantom price printed a new monthly low at $1.03.
- FTM price has more space to fall on the Relative Strength Index.
- A break above $1.45 would invalidate the bearish idea.

Fantom price is currency trading at $1.22. The overall trend is relatively strong, but more correction could still be underway.
Fantom price has more bearish potential
Fantom price has the potential for an additional 30% drop into a previous resistance zone. Last week’s 2-week candle has already broken through the previous support level on the Relative Strength Index. Investors could see an additional low printed in the coming weeks if bears maintain price action within the current support zone.
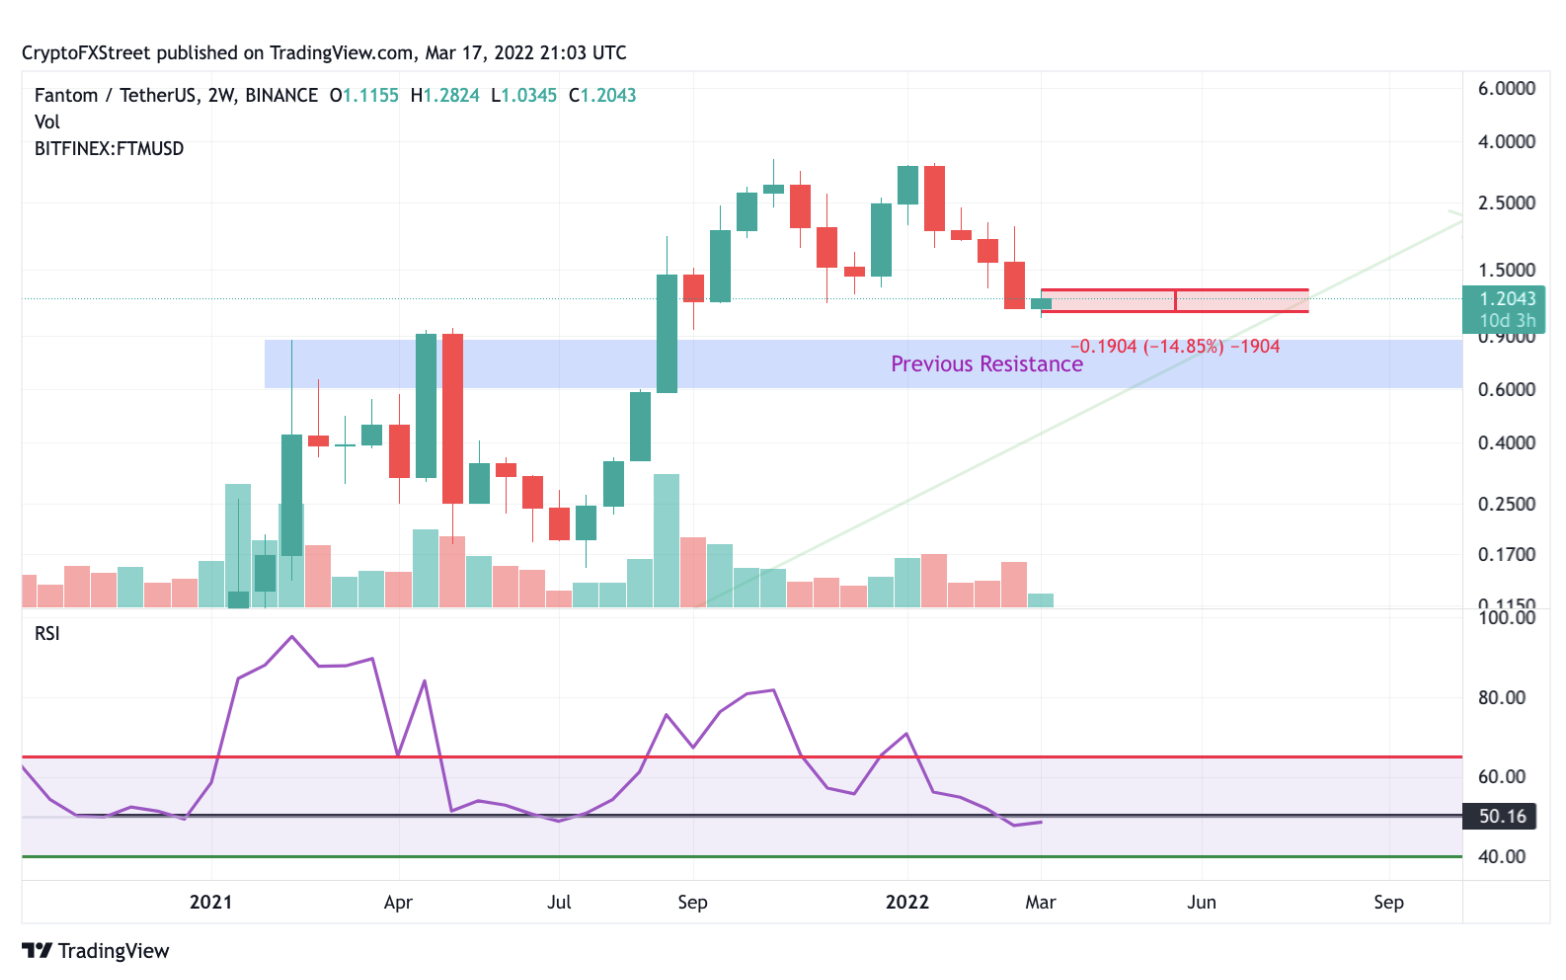
FTM/USDT 2-Week Chart
Fantom price is likely to continue printing price action within the 14% range that it has been confined to this week. Crypto traders are likely to be eyeing other assets as there is not much evidence of short-term bullish strength from the chart.
An invalidation for the bearish thesis will be if the bulls can break past the current two-week candle high at $1.45. The price is likely to fluctuate for weeks to come between $1.40 and $1.22. If the bulls can pull off a rally, prices could inch towards $1.44. It is worth noting that the overall trend is very steep but has lots of room left for consolidation. More long-term investors should keep their eyes on when future price action comes in contact with the trendline.
Author

FXStreet Team
FXStreet
Composed of a group of economic journalists and FX experts, the FXStreet content team produces and oversees all content published on FXStreet. It provides a purely journalistic approach to the Forex market.




