XRP retains bullish outlook despite paring gains above $1.50
- XRP consolidates early-week gains above the short-term $1.50 support level amid a bullish technical bias.
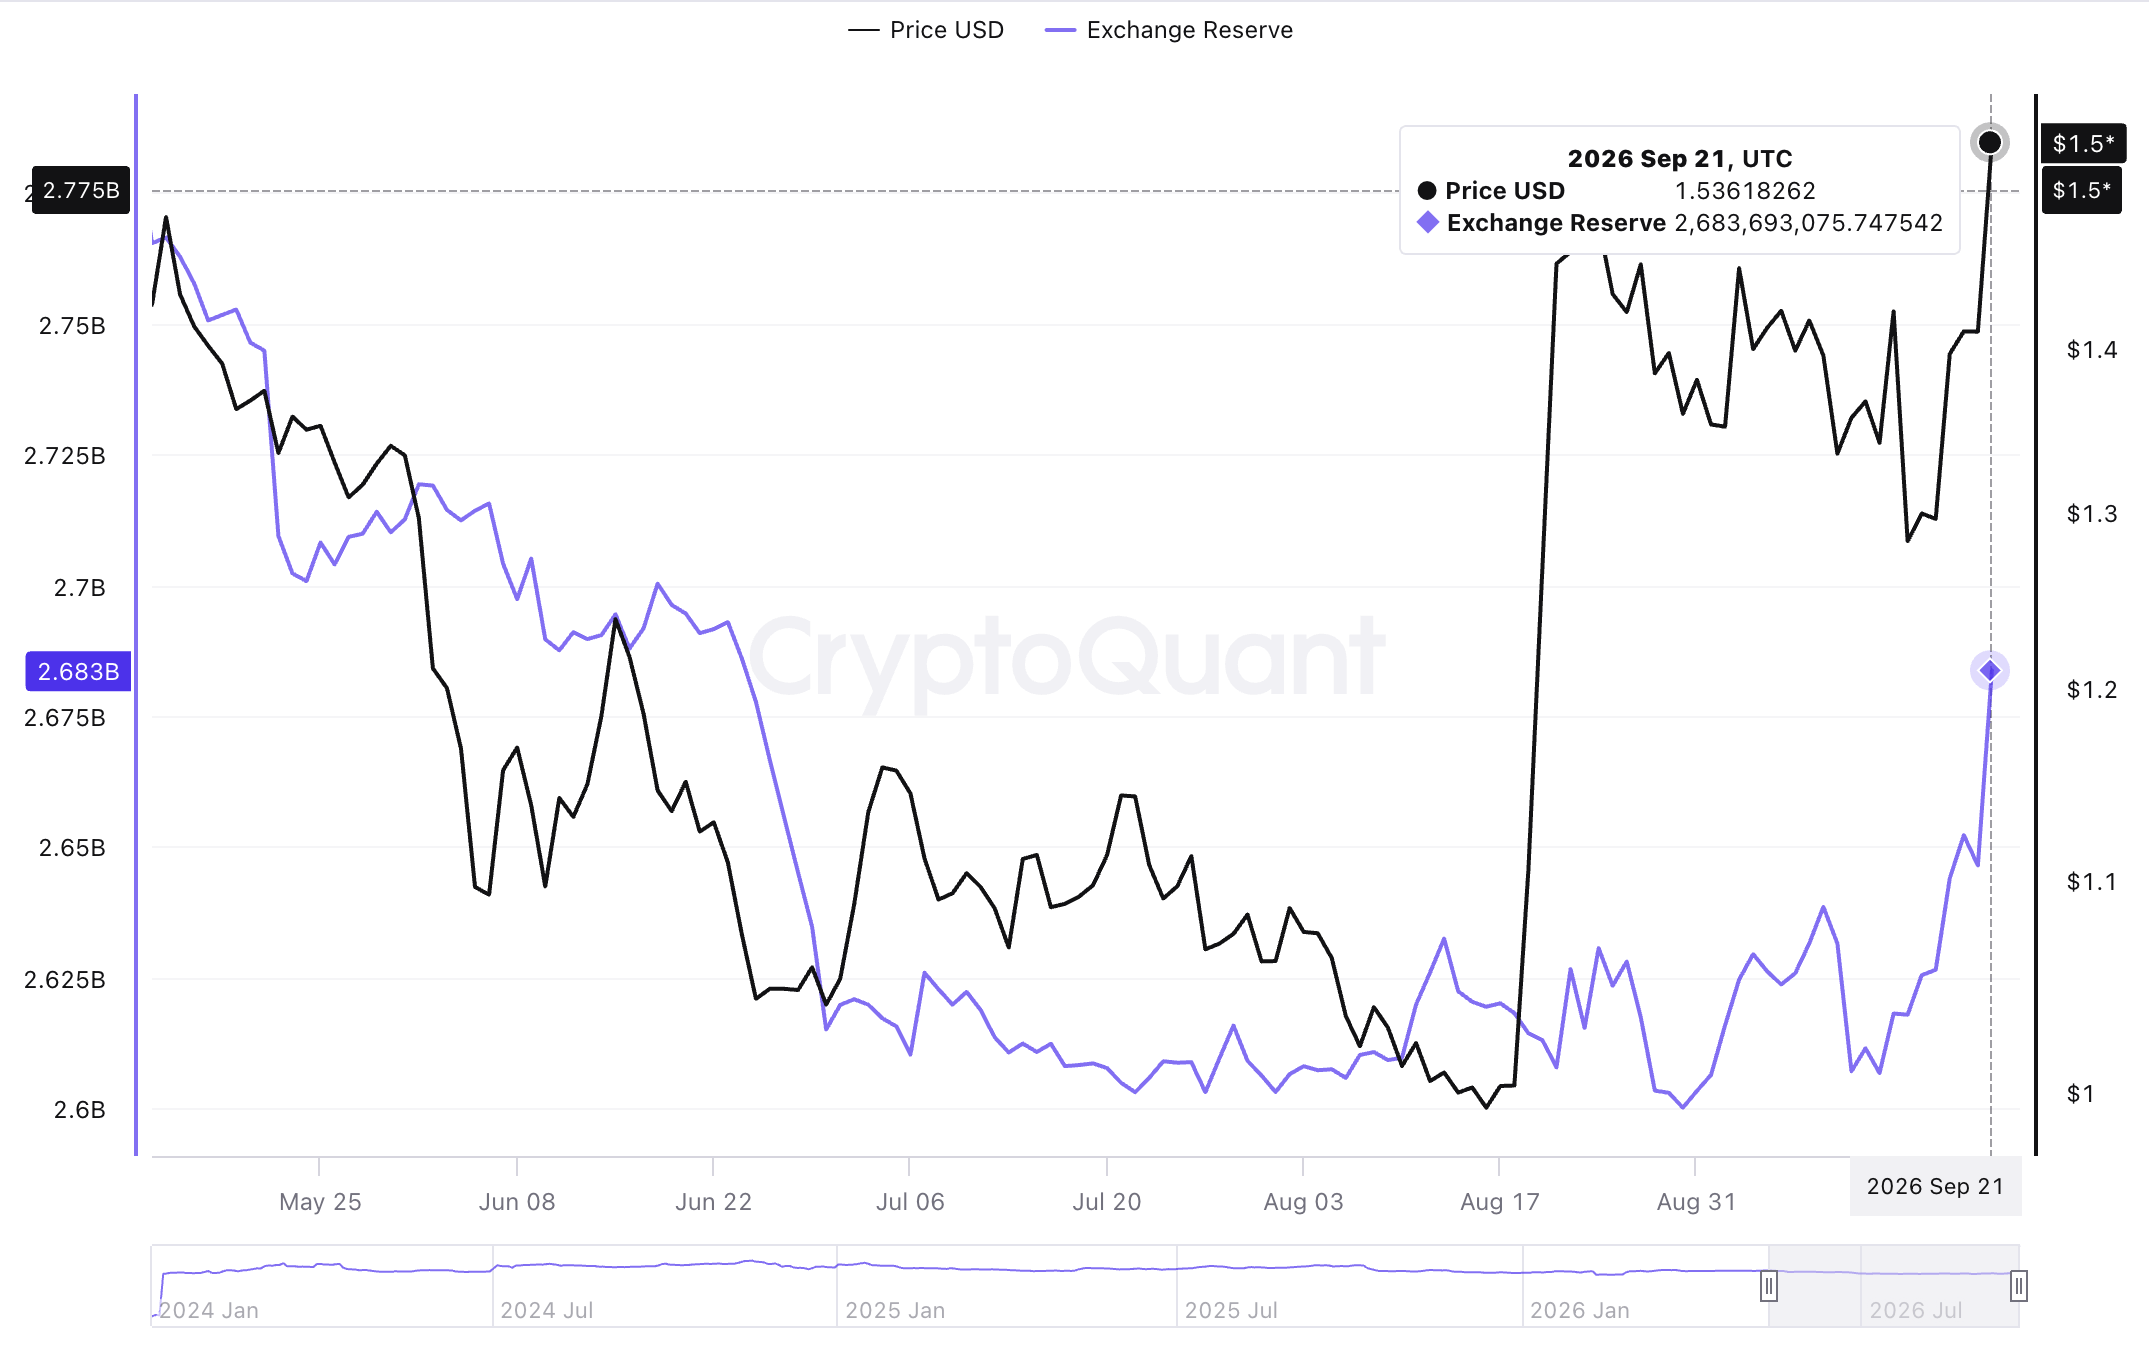
- XRP Exchange Reserves on Binance rise to 2.68 billion XRP, suggesting increased trading activity or that holders are preparing to sell.
- XRP bulls battle to flip the 50-week and 100-week EMAs into support, backed by strengthening momentum indicators.

Ripple (XRP) trades elevated above $1.52 on Tuesday despite experiencing a minor correction from the previous day’s high of $1.57. XRP framed the uptrend last week, rising alongside the broader bullish cryptocurrency market.
Buying interest broadly increased against the backdrop of the Federal Reserve (Fed) raising interest rates to the 3.75%-4.00% range last Wednesday, as well as the United States (US) CLARITY Act, which failed to advance in the Senate.
Continued trading above immediate support at $1.50 could encourage investors to increase exposure, anticipating a continuation of the uptrend toward August highs at $1.70 and the next key hurdle at $2.00. Nonetheless, traders should tread with caution, as retreats could destabilize the market.
XRP faces rising exchange reserves
XRP holders are increasingly moving assets to exchanges as the price edges higher. There’s currently a total of 2.68 billion XRP on the Binance exchange, after rising by nearly 3% from September 1.
Higher exchange reserves suggest investors are moving tokens to the exchange to trade or sell and lock in profits amid higher prices. It is too early to determine the outcome; hence, traders should closely watch price movements around key supply and demand zones.
Technical Analysis: XRP bulls broadly retain control
XRP trades at $1.52, maintaining a bullish near-term bias as price holds well above the main Exponential Moving Averages (EMAs). The 50-day EMA at $1.32, the 100-day EMA at $1.28, and the 200-day EMA at $1.36 sit below spot, suggesting a constructive underlying trend, while the SuperTrend line at $1.26 adds structural support.
Momentum remains positive, with the Moving Average Convergence Divergence (MACD) histogram above zero hinting at persistent bullish pressure. The Relative Strength Index (RSI) at 64 reinforces a strong but not yet overbought backdrop.
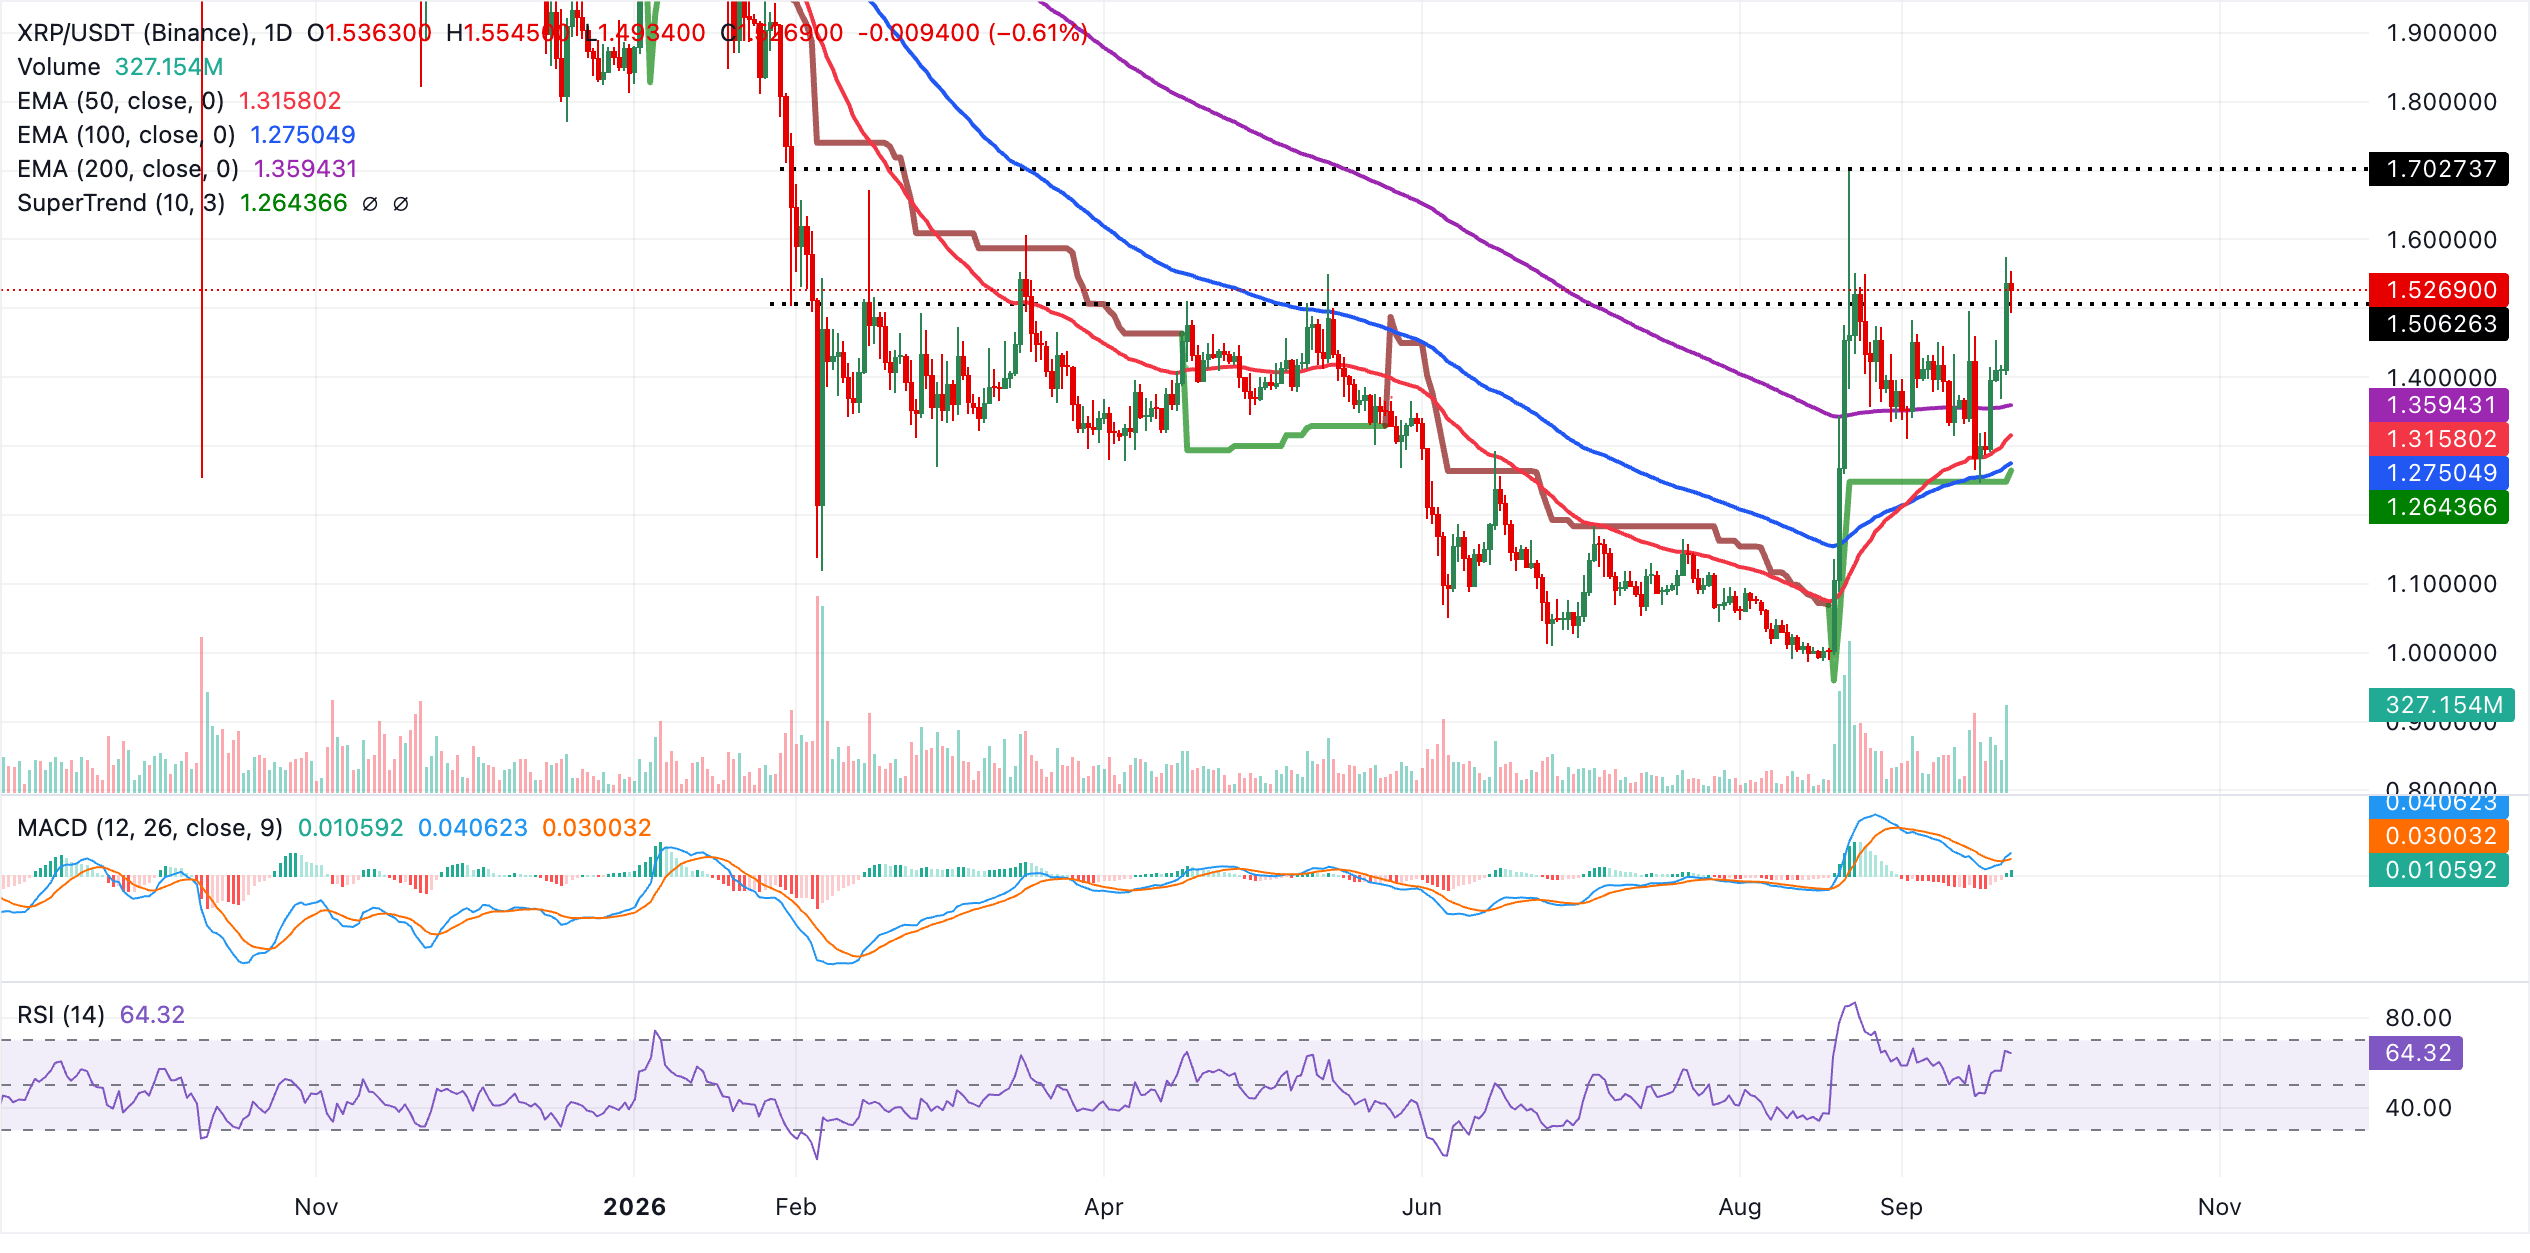
Immediate support is seen at the 200-day EMA near $1.36, with the shorter 50-day EMA at $1.32 and the 100-day EMA at $1.28 forming a secondary demand band on deeper pullbacks. A more strategic floor emerges around the SuperTrend level at $1.26, where buyers would be expected to defend the broader uptrend. With no structural resistance levels shown on the daily chart, the pair appears technically free to probe higher ground in the near term, as long as daily closes remain above the immediate $1.40-$1.50 psychological demand.
At the same time, the remittance token maintains a bullish near-term bias as price holds above the 50-week EMA at $1.52 and the longer-term 200-week EMA at $1.37. The SuperTrend line at $0.93 sits well below the market, reinforcing a supportive underlying structure, while RSI at 56 suggests constructive but not overextended momentum.
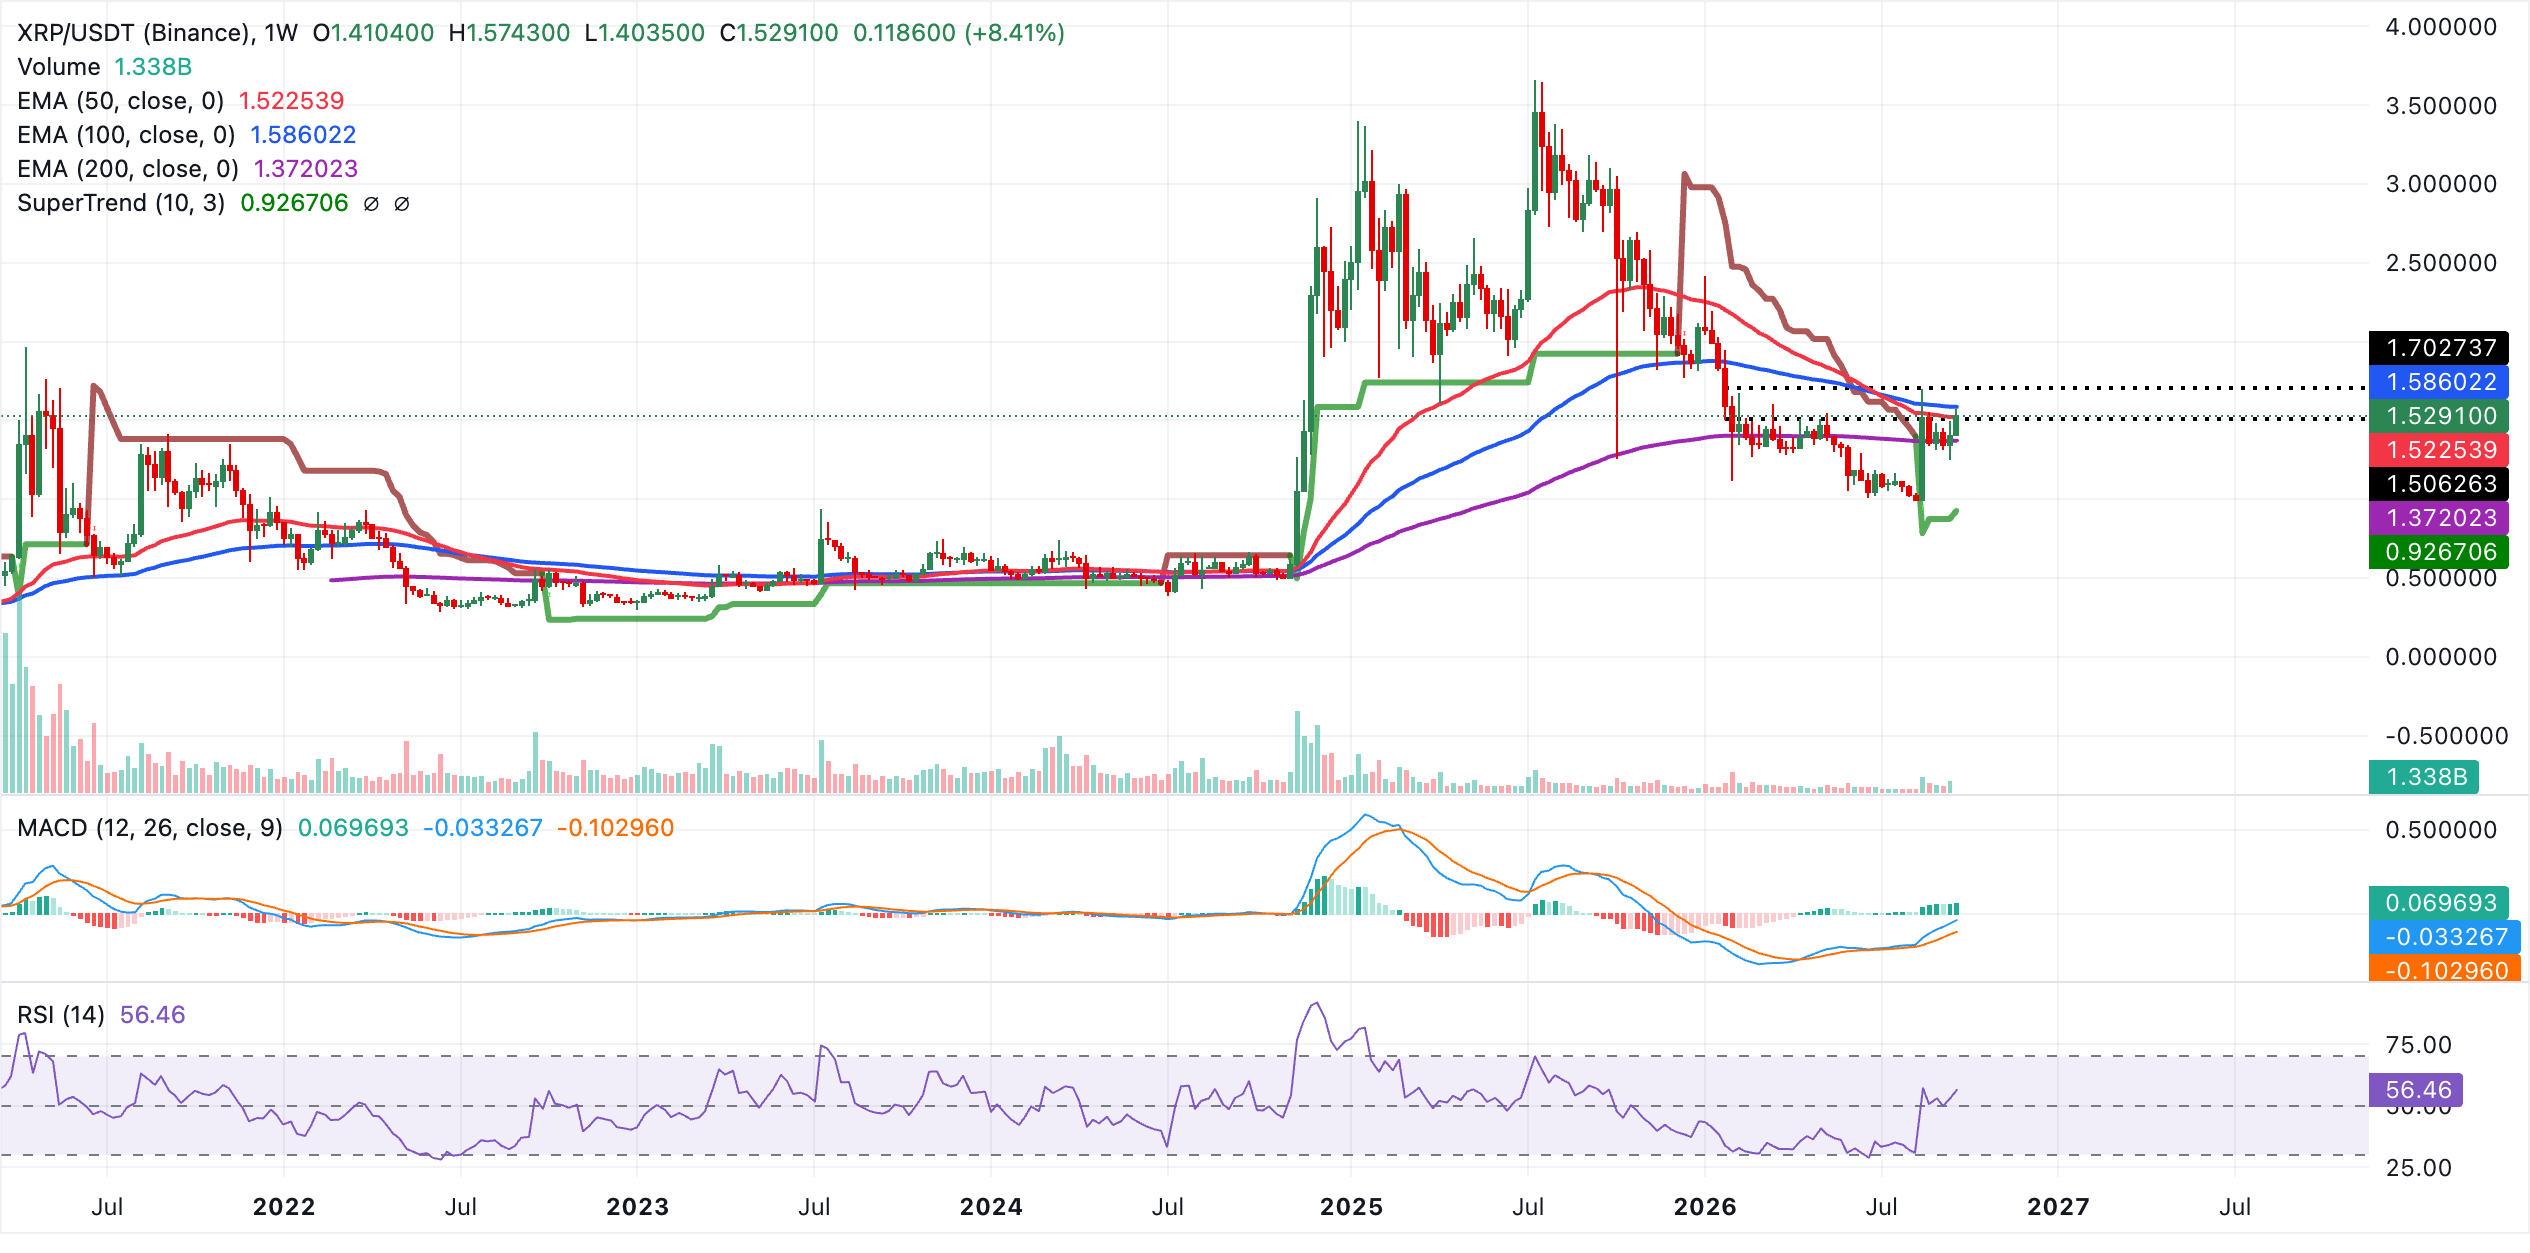
On the topside, initial resistance is defined by the 100-week EMA at $1.59, which marks the next hurdle for bulls and a potential cap on the current advance if rejected. On the downside, immediate technical support sits at the 50-week EMA near $1.52, with a deeper protective layer at the 200-week EMA at $1.37, ahead of the more distant SuperTrend support zone around $0.93.
(The technical analysis of this story was written with the help of an AI tool. Know more.)
Cryptocurrency metrics FAQs
The developer or creator of each cryptocurrency decides on the total number of tokens that can be minted or issued. Only a certain number of these assets can be minted by mining, staking or other mechanisms. This is defined by the algorithm of the underlying blockchain technology. On the other hand, circulating supply can also be decreased via actions such as burning tokens, or mistakenly sending assets to addresses of other incompatible blockchains.
Market capitalization is the result of multiplying the circulating supply of a certain asset by the asset’s current market value.
Trading volume refers to the total number of tokens for a specific asset that has been transacted or exchanged between buyers and sellers within set trading hours, for example, 24 hours. It is used to gauge market sentiment, this metric combines all volumes on centralized exchanges and decentralized exchanges. Increasing trading volume often denotes the demand for a certain asset as more people are buying and selling the cryptocurrency.
Funding rates are a concept designed to encourage traders to take positions and ensure perpetual contract prices match spot markets. It defines a mechanism by exchanges to ensure that future prices and index prices periodic payments regularly converge. When the funding rate is positive, the price of the perpetual contract is higher than the mark price. This means traders who are bullish and have opened long positions pay traders who are in short positions. On the other hand, a negative funding rate means perpetual prices are below the mark price, and hence traders with short positions pay traders who have opened long positions.
Author

John Isige
FXStreet
John Isige is a seasoned cryptocurrency journalist and markets analyst committed to delivering high-quality, actionable insights tailored to traders, investors, and crypto enthusiasts. He enjoys deep dives into emerging Web3 tren