Ethereum’s road map to $6,000 is still intact

Our previous update indicated that, according to the Elliott Wave (EW) Principle, for Ethereum (ETH) “…. [Alternatively], if the Bulls can’t clear the 200-day SMA and the price falls below last week’s low, then the red W-i of the new bull run to $6100+ has already peaked. In that scenario, we can expect Ether to reach around $2100 a bit sooner, before the rally to approximately $5000 begins.”
Fast forward three weeks, and Ether had been unable to break above the (Red) 200-d SMA until Monday, thereby following our alternative path. However, it stalled at approximately $2380, resulting in just a ~23.8% retracement instead of the more typical 50-61.8% retracement for a second wave (Red w-ii). More about that in a moment. See Figure 1 below.
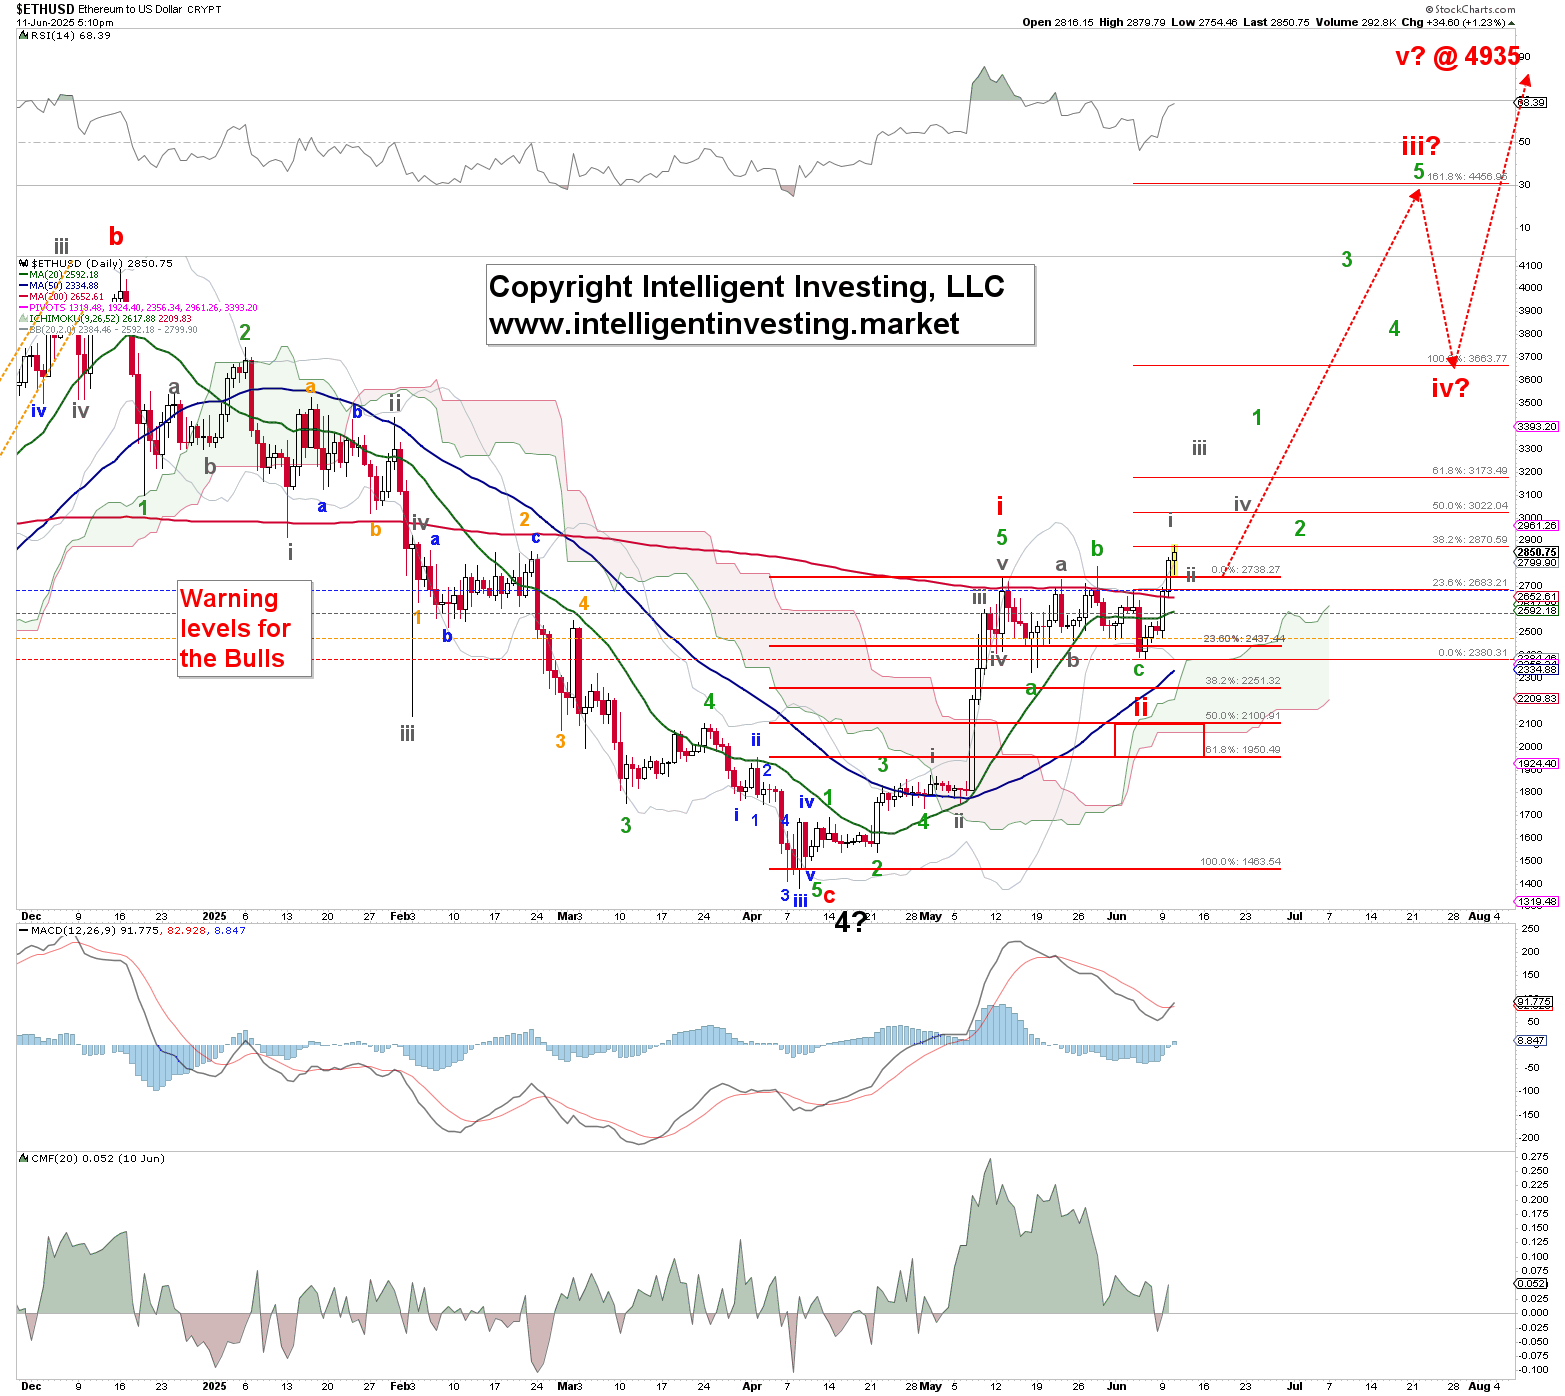
Figure 1. Our preferred short-term EW count for Ethereum.
Although it's shallow, the red W-ii is acceptable and the red W-iii is starting, as ETH is finally breaking through its (Red) 200d SMA. Therefore, the red W-iii should now be underway and will subdivide into five smaller (green) waves. Those, in turn, will further subdivide into five even smaller (gray) waves, etc.
Consequently, the gray W-i of the green W-1 of the red W-iii should now be underway. The ideal Fib-based targets for the red W-iii, iv, and v are minimums since we still expect at least $6100+ to be reached based on the bullish pennant pattern we’ve shared before.
Although the retracement for the red W-ii was not as deep as expected, it's important to note that markets do not have to follow textbook retracements (50-62%) as corrections. The purpose of correcting, from a technical perspective, is to eliminate overbought conditions. This can be achieved either through time (sideways) or price (deep). Therefore, given the sideways price action, our alternative now is that the current rally from Friday’s low represents the green W-5 of the red W-i. See Figure 2 below.
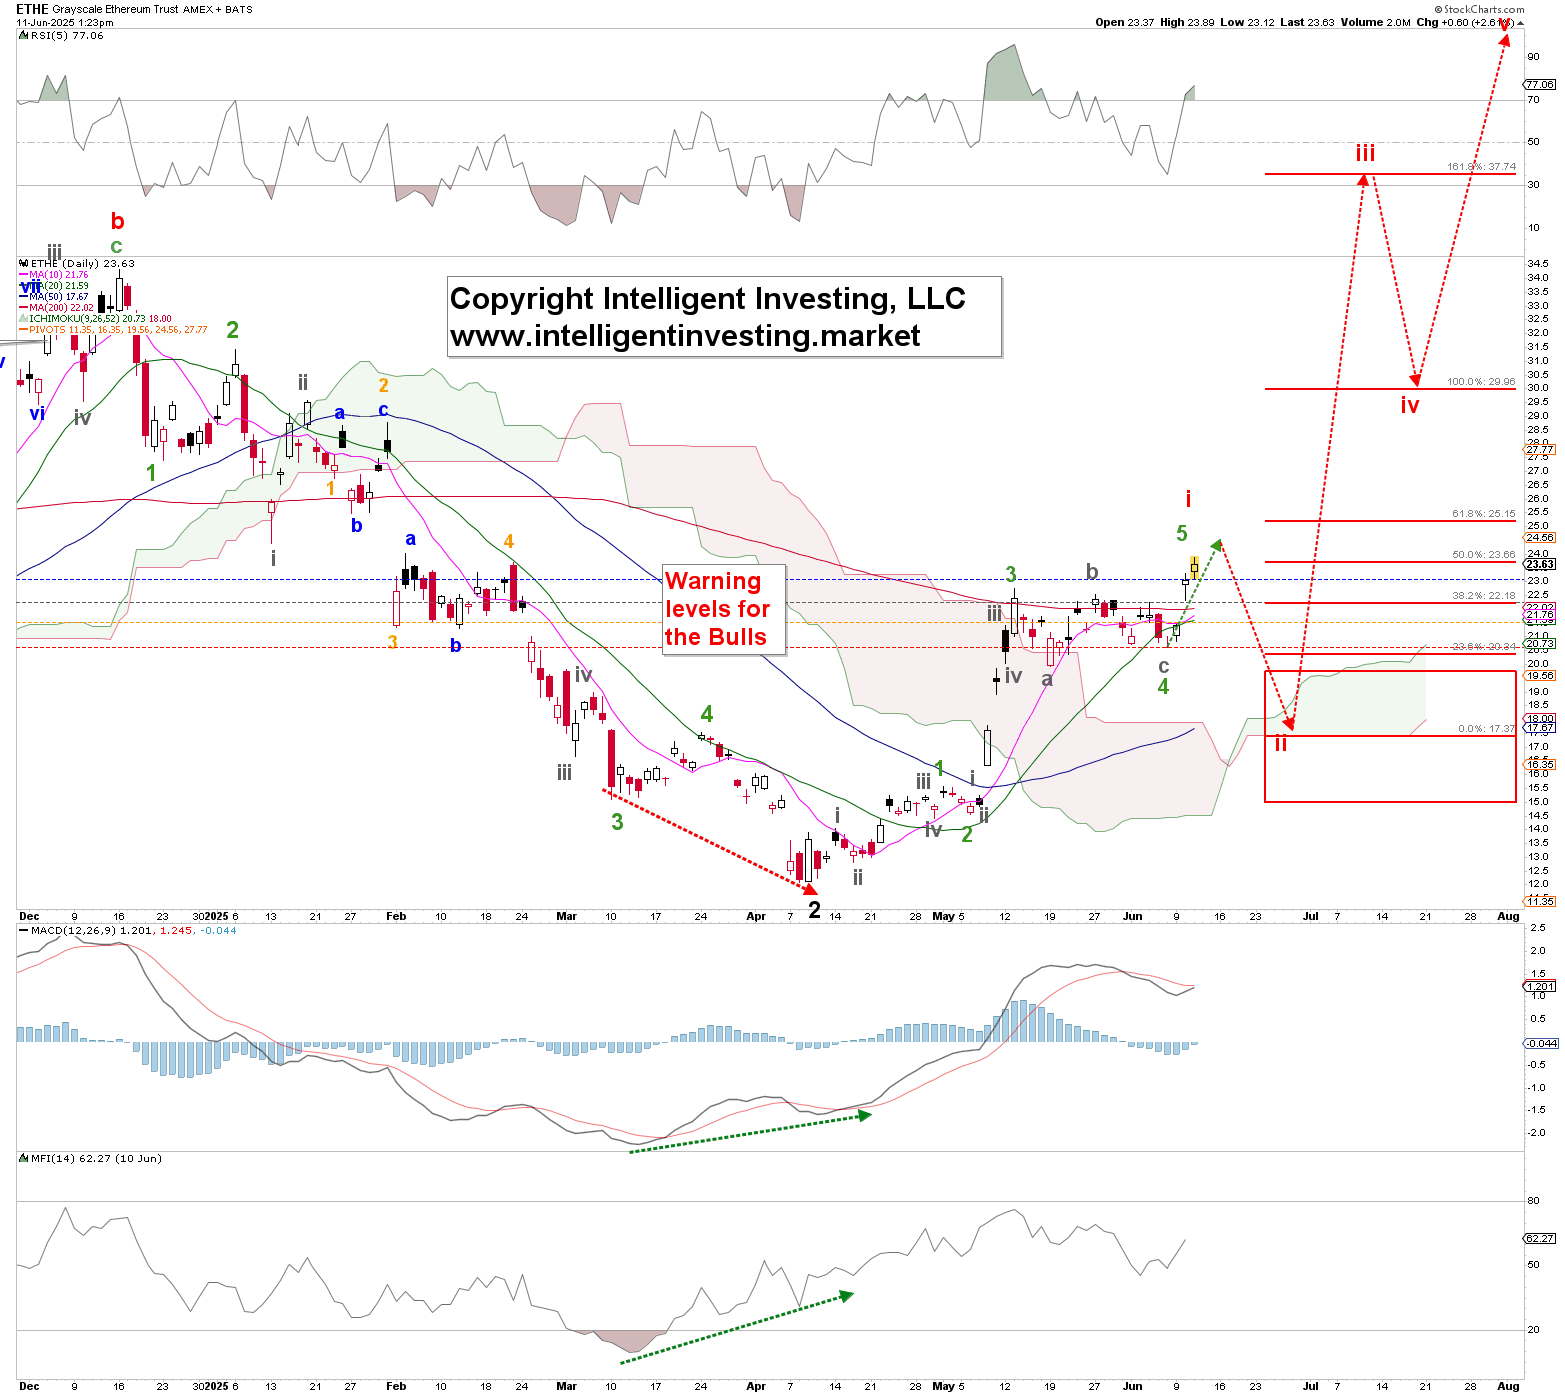
Figure 2. Our alternative, short-term EWP count for Ethereum.
Here, we use the Grayscale Ethereum Trust (ETHE) Exchange-Traded Fund (ETF) to illustrate what that would look like. In this case, we anticipate the red W-i to peak at around $25 for ETHE and approximately $3,000 for ETH. From there, we can still expect a deeper red W-ii to ideally be around $2,250 +/- $75 for Ethereum and $17.50 +/- $2.50 for ETHE, before the red W-iii kicks in. However, the bears will need to push the price back below last Friday’s low (ETHE $20.60, ETH $2385) to initiate this alternative. Therefore, we have, thanks to the EW, an excellent stop level, i.e., risk/reward, to work with if desired.
Regardless, both paths lead to Rome, so to speak, and we must not lose sight of what truly matters: the third wave to ~$5000+ for ETH. See the forest for the trees, because “big gains come from big time frames,” as the short term is always more variable and uncertain than the long term. We present these two options not to confuse, but to clarify our expectations. We’re simply thinking ahead, and neither price movement will catch us off guard, allowing us to be prepared.
Author

Dr. Arnout Ter Schure
Intelligent Investing, LLC
After having worked for over ten years within the field of energy and the environment, Dr.


