|

Ethereum Technical Analysis: ETH/USD tries to recover following bearish Thursday

  • ETH/USD dropped from $174.70 to $161.25 this Thursday.
  • The daily chart shows that the RSI indicator is trending around 32.35, next to the oversold zone.

ETH/USD daily chart

fxsoriginal

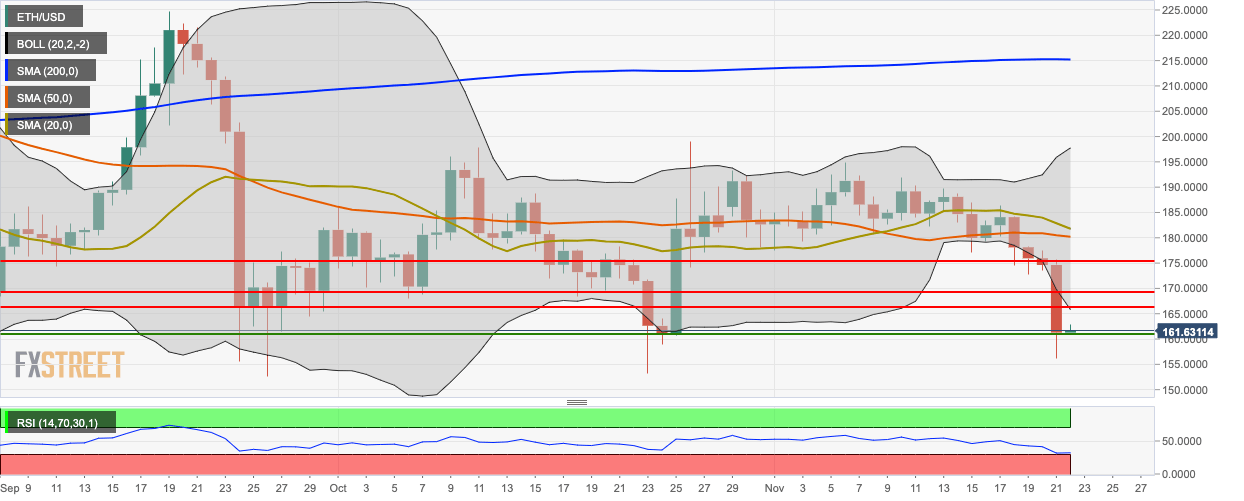
The daily ETH/USD price has dropped below the 20-day Bollinger curve, indicating that it is undervalued. The Bollinger jaw has widened, showing increasing price volatility. The pair is also floating below the 200-day Simple Moving Average (SMA 200), SMA 50 and SMA 20 curves. 

ETH/USD 4-hour chart

fxsoriginal

The 4-hour chart shows that the price dropped from $175.25 to $160.45 in 16 hours. Having found support at the $160.45 level and gone up to $161.75. The Elliott Oscillator has had five straight red sessions. The Bollinger width has gone up from 0.067 to 0.14, indicating increasing volatility.

ETH/USD hourly chart

fxsoriginal

The hourly ETH/USD is trending in an upwards channel formation and is floating below the SMA 20, SMA 50 and SMA 200 curves. Currently, the hourly price has found resistance at the $162.75 line and dropped to $161.75.

Key Levels

ETH/USD

Overview
Today last price161.74
Today Daily Change0.46
Today Daily Change %0.29
Today daily open161.28
 
Trends
Daily SMA20182.87
Daily SMA50180.37
Daily SMA100183.93
Daily SMA200215.01
 
Levels
Previous Daily High175.76
Previous Daily Low156.22
Previous Weekly High191.89
Previous Weekly Low177.06
Previous Monthly High199.04
Previous Monthly Low153.28
Daily Fibonacci 38.2%163.68
Daily Fibonacci 61.8%168.29
Daily Pivot Point S1153.08
Daily Pivot Point S2144.88
Daily Pivot Point S3133.54
Daily Pivot Point R1172.62
Daily Pivot Point R2183.95
Daily Pivot Point R3192.15


Author

Rajarshi Mitra

Rajarshi Mitra

Independent Analyst

Rajarshi entered the blockchain space in 2016. He is a blockchain researcher who has worked for Blockgeeks and has done research work for several ICOs. He gets regularly invited to give talks on the blockchain technology and cryptocurrencies.

More from Rajarshi Mitra
Share:

Markets move fast. We move first.

Orange Juice Newsletter brings you expert driven insights - not headlines. Every day on your inbox.

By subscribing you agree to our Terms and conditions.

Editor's Picks

Cardano holds steady as bulls intensify push for breakout

Cardano rises above the 50-day EMA resistance amid a risk-on mood across the crypto market. The MACD upholds positive divergence, increasing the potential for a 20% breakout to $0.505.

XRP poised for breakout as ETF inflows and bullish momentum align

Ripple is showing strength, trading at $2.36 at the time of writing on Tuesday. The cross-border remittance token has maintained a steady uptrend for six consecutive days, underscoring steady inflows into XRP spot Exchange Traded Funds.

Crypto Today: Bitcoin, Ethereum, XRP uptrend cools amid surging ETF inflows

Bitcoin is retracing toward support at $93,000 at the time of writing on Tuesday, after reaching a previous day’s high of $94,789. Ethereum and Ripple uptrend has cooled after several days of persistent gains, suggesting potential profit-taking.

Bitcoin holds above $93,000 as ETF inflows continue and Strategy boosts holdings

Bitcoin price trades around $93,000 at the time of writing on Tuesday, pausing near a key resistance zone after its recent advance. Institutional demand remains supportive, with US-listed spot ETFs recording their largest single-day inflow since early October.

Orange Juice Newsletter – Smart insights by real people. Every day.

A free newsletter highlighting key market trends to help traders stay a step ahead. Daily insights on the most relevant trading topics, compiled by our experts in an easy-to-read format so you never miss an important move.

Bitcoin: Fed delivers, yet fails to impress BTC traders

Bitcoin (BTC) continues de trade within the recent consolidation phase, hovering around $92,000 at the time of writing on Friday, as investors digest the Federal Reserve’s (Fed) cautious December rate cut and its implications for risk assets.