|

Ethereum Technical Analysis: ETH/USD bulls falter at $200-level

ETH/USD Daily Chart

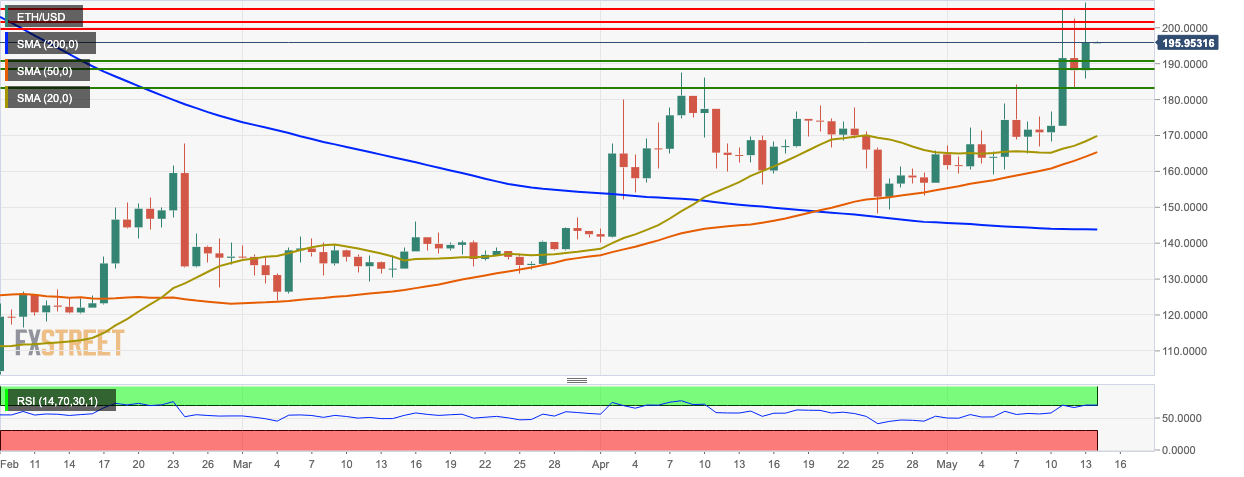
  • ETH/USD is currently trading at $197.80 this Tuesday.
  • This Monday, the price went up to $207.20, before the bears re-entered the market and brought it down to $196 at EOD.
  • The price is trading above the SMA 200, SMA 50, and SMA 20 curves.
  • The Relative Strength Index (RSI) indicator is trending in the overbought zone.

ETH/USD 4-Hour Chart

  • The 4-hour ETH/USD market found support at $195.25.
  • The signal line is converging with the MACD line indicating decreasing bullish momentum.
  • The Ichimoku Indicator shows upcoming bearish sentiment.
  • On the downside, support levels lie at $194.

ETH/USD Hourly Chart

  • The 20-day Bollinger band in the hourly ETH/USD chart is narrowing, which shows decreasing market volatility.
  • The second last session was extremely bearish and brought the price down to the 20-day simple moving average (SMA 20).
  • The hourly ETH/USD found support on the SMA 20 curve and bounced back up.
  • The second last session brought the price below the upward trending line.
  • The Elliot Oscillator shows five consecutive bearish sessions.

Key Levels

ETH/USD

Overview
Today last price196.06
Today Daily Change0.20
Today Daily Change %0.10
Today daily open195.86
 
Trends
Daily SMA20168.39
Daily SMA50163.56
Daily SMA100147.34
Daily SMA200144.67
Levels
Previous Daily High207.18
Previous Daily Low185.77
Previous Weekly High184.09
Previous Weekly Low159.05
Previous Monthly High187.51
Previous Monthly Low140.14
Daily Fibonacci 38.2%199.01
Daily Fibonacci 61.8%193.95
Daily Pivot Point S1185.36
Daily Pivot Point S2174.86
Daily Pivot Point S3163.95
Daily Pivot Point R1206.77
Daily Pivot Point R2217.69
Daily Pivot Point R3228.19

Author

Rajarshi Mitra

Rajarshi Mitra

Independent Analyst

Rajarshi entered the blockchain space in 2016. He is a blockchain researcher who has worked for Blockgeeks and has done research work for several ICOs. He gets regularly invited to give talks on the blockchain technology and cryptocurrencies.

More from Rajarshi Mitra
Share:

Editor's Picks

XRP steadies in narrow range as fund inflows, futures interest rise

Ripple is trading in a narrow range between $1.45 (immediate support) and $1.50 (resistance) at the time of writing on Monday. The remittance token extended its recovery last week, peaking at $1.67 on Sunday from the weekly open at $1.43. 

Crypto Today: Bitcoin, Ethereum, XRP trade within range amid low retail interest 

Bitcoin, Ethereum and Ripple continue to exhibit subdued volatility, consolidating within narrow ranges at the time of writing on Monday. Persistent low retail participation and weak technical structures limit the chances of any extended upside price movements.

Bitcoin consolidates as on-chain data show mixed signals

Bitcoin price has consolidated between $65,700 and $72,000 over the past nine days, with no clear directional bias. US-listed spot ETFs recorded a $359.91 million weekly outflow, marking the fourth consecutive week of withdrawals.

Monero Price Forecast: XMR risks a drop below $300 under mounting bearish pressure

Monero (XMR) starts the week under pressure, recording a 4% decline at press time on Monday after a 7% drop the previous day, putting the $300 support zone in focus.

Bitcoin Price Annual Forecast: BTC holds long-term bullish structure heading into 2026

Bitcoin (BTC) is wrapping up 2025 as one of its most eventful years, defined by unprecedented institutional participation, major regulatory developments, and extreme price volatility.

Bitcoin: BTC bears aren’t done yet

Bitcoin (BTC) price slips below $67,000 at the time of writing on Friday, remaining under pressure and extending losses of nearly 5% so far this week.