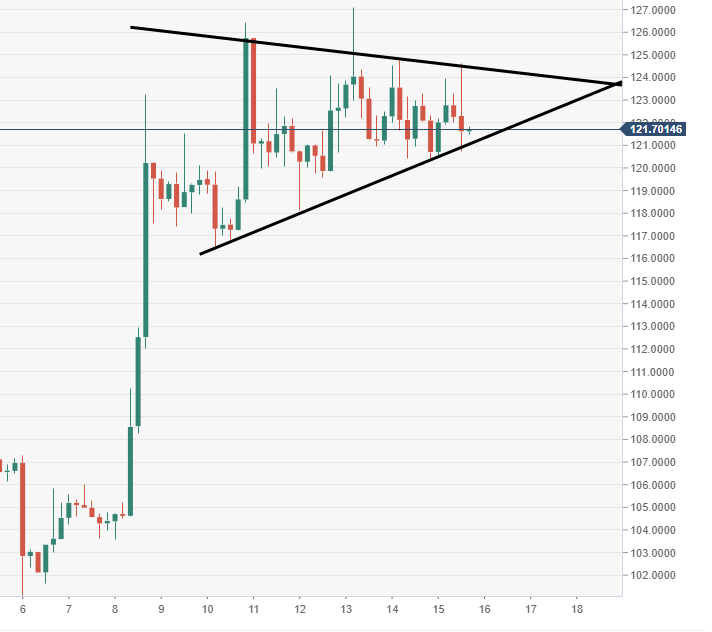
Ethereum Technical Analysis: ETH/USD bullish pennant pattern subject to a possible breakout higher
- Ethereum price is trading in minor positive territory on Friday, holding gains of 0.8%.
- ETH/USD price action has formed potential bullish pennant pattern formation, subject to a breakout higher, via the 4-hour view.

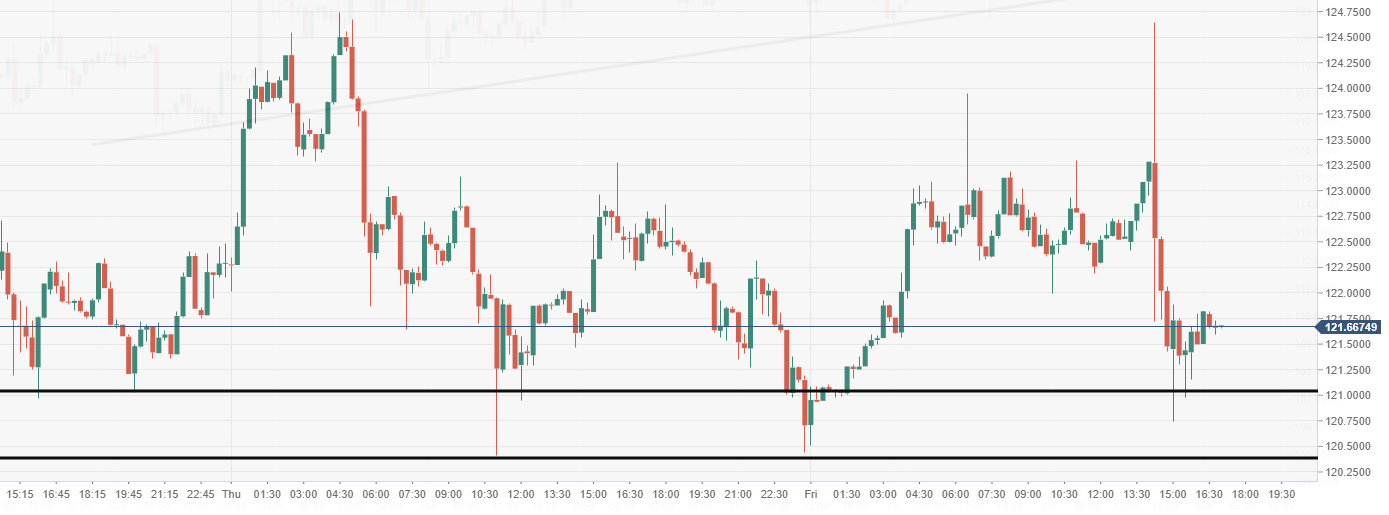
ETH/USD 15-minute chart
- Chunky buyers are seen in force protecting the $120 price area, near-term demand zone.
Spot rate: 121.71
Relative change: +0.80%
High: 124.63
Low: 120.73
Trend: Neutral
Support 1: 119.17, daily pivot point support.
Support 2: 117.63, daily pivot point support.
Support 3: 114.84, daily pivot point support.
Resistance 1: 123.5, daily pivot point resistance.
Resistance 2: 126.29, daily pivot point resistance.
Resistance 3: 127.83, daily pivot point resistance.
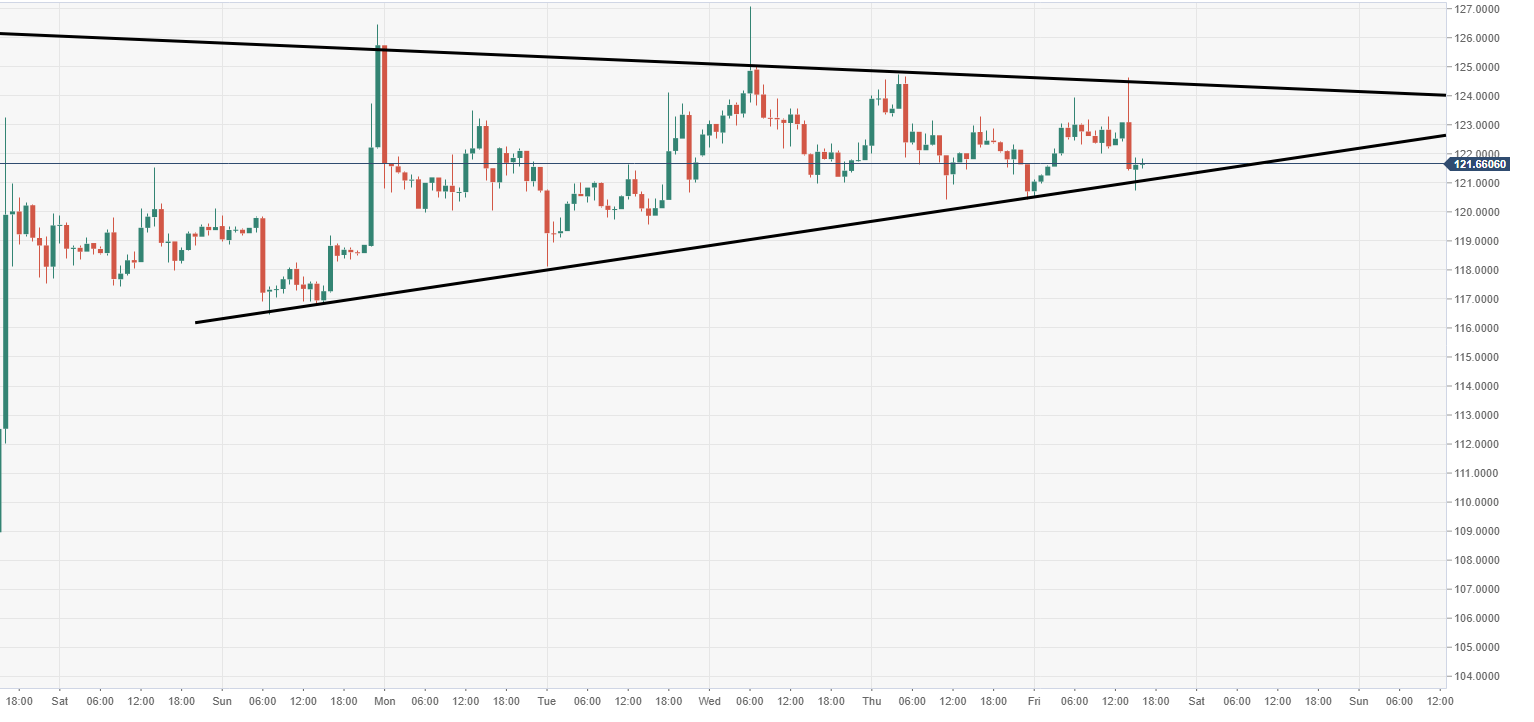
ETH/USD 60-minute chart
- ETH/USD via the 60-minute is respecting the triangular pattern, trading is narrowing greatly within.
ETH/USD 4-hour chart
- Price action moving within a triangular structure, somewhat of a pennant pattern formation, subject to a potential breakout north.
Author

Ken Chigbo
Independent Analyst
Ken has over 8 years exposure to the financial markets. He started his career as an analyst, covering a variety of asset classes; forex, fixed income, commodities and equities.


