Ethereum technical analysis: ETH/USD bounces off a critical area of support
- Ethereum price in the second part of Friday is trading in minor positive, gains of some 2.5%.
- ETH/USD bounced off a critical ascending trend line of support, a failure to hold could see $200 at threat.
- Should the bulls break down the monthly high at $288, eyes will be on a firm move into $300 territory.

Spot rate: 260.85
Relative change: +2.50%
High: 262.53
Low: 244.84
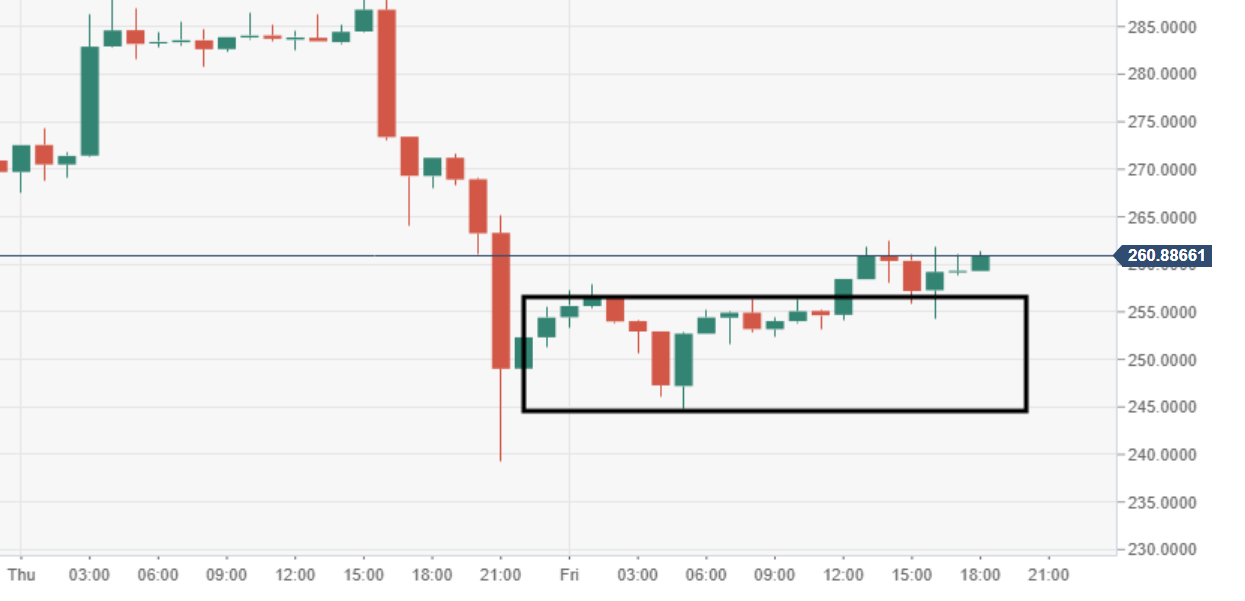
ETH/USD 60-minute chart
- Price action earlier in the session managed to break out from a narrowing range-block formation, the price has retested and now room to push further north.
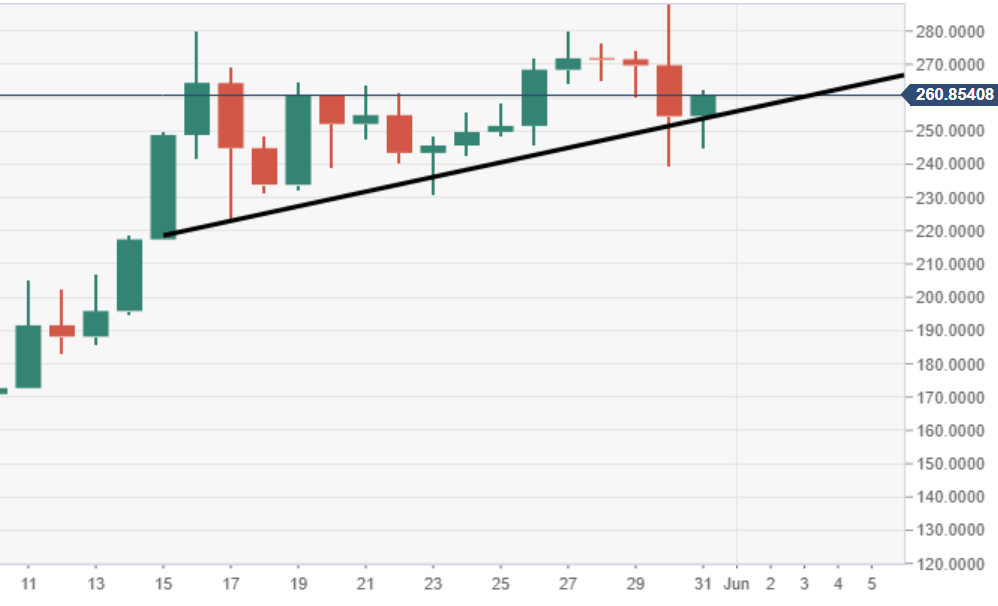
ETH/USD daily chart
- A near-term critical area of support has been tested, an ascending trend line, a breach could expose $200 to the downside. Otherwise, eyes on a bounce for another attempt at the $300 territory.
Author

Ken Chigbo
Independent Analyst
Ken has over 8 years exposure to the financial markets. He started his career as an analyst, covering a variety of asset classes; forex, fixed income, commodities and equities.
More from Ken Chigbo


