Ethereum technical analysis: ETH/USD bearish flag structure remains subject to a breakout
- Ethereum price is trading in the red, down 0.15% the session on Wednesday.
- ETH/USD trading conditions are extremely tight, as the price moves within a flag pattern.
- The price over the last 11 days has been moving within a $5-7 range.

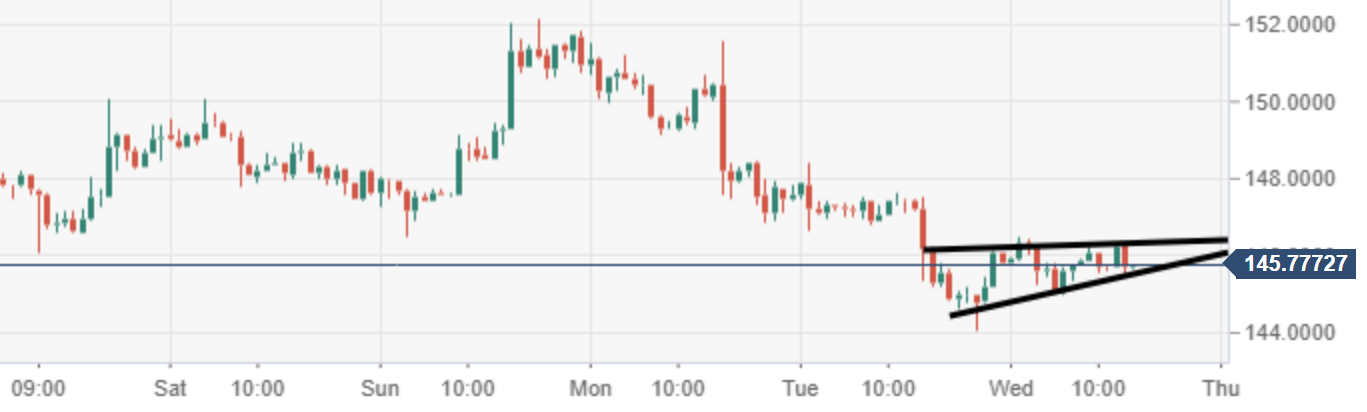
ETH/USD 60-minute chart
Price action via the 60-minute chart view remains bearish, moving within a pennant structure, vulnerable to downside risks.
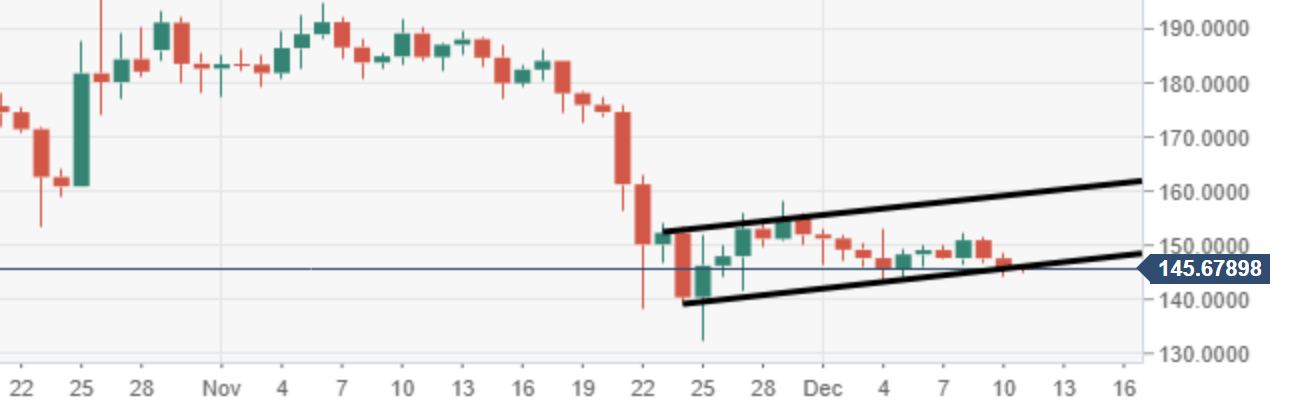
ETH/USD daily chart
The range via the daily remains narrow, to the high of $150, a big barrier and to the low of $145. A tight $5 range, which continues to contain the price.
Spot rate: 145.64
Relative change: -0.15%
High: 146.48
Low: 144.99
Author

Ken Chigbo
Independent Analyst
Ken has over 8 years exposure to the financial markets. He started his career as an analyst, covering a variety of asset classes; forex, fixed income, commodities and equities.
More from Ken Chigbo


