Ethereum Technical Analysis: ETH eyes $500
- Ethereum rallied by 10.50% over the last four days.
- ETH managed to peak above the 50-day SMA this Saturday.

ETH managed to string together four consecutive bullish sessions in its daily chart, rallying by 10.5%. Currently, the smart contract giant is trading for $376.50 and has managed to cross above the 50-day SMA. The bulls now need to consolidate their position above the 50-day SMA to break above this level and aim for the $485 resistance line.
ETH/USD daily chart
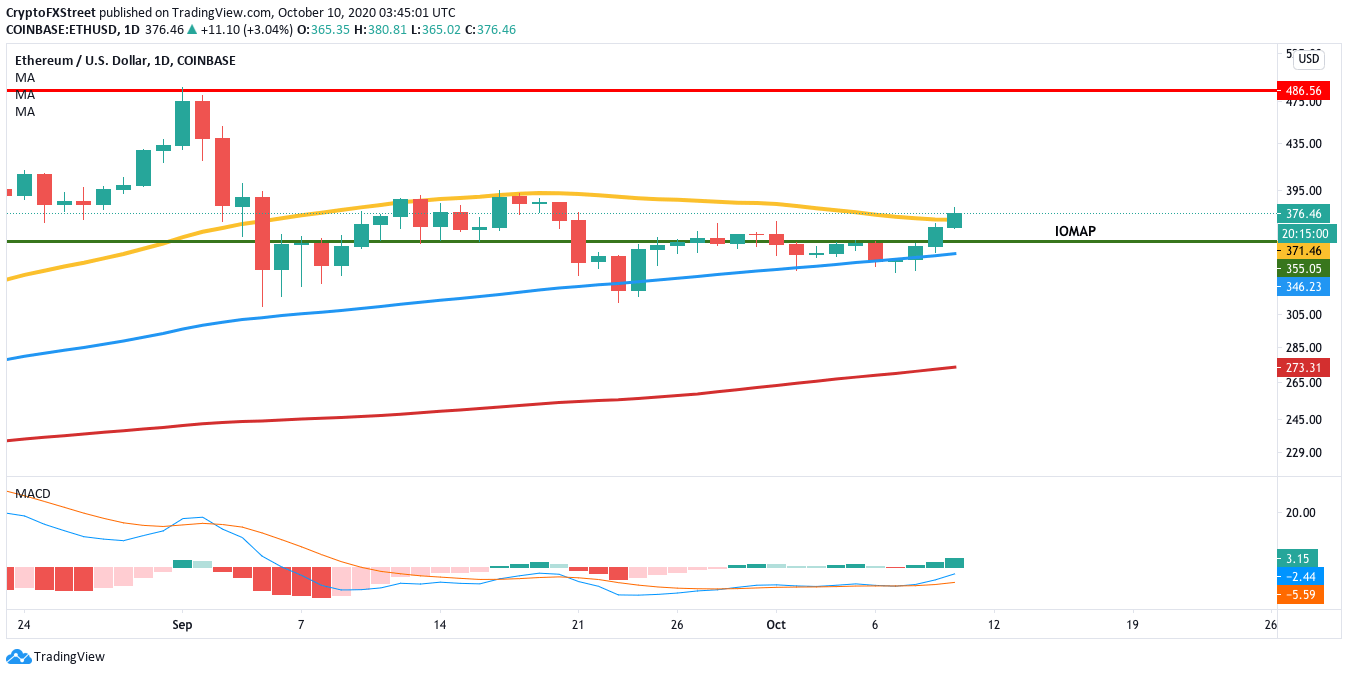
The bullish outlook is further validated by the MACD, which shows increasing bullish momentum. The bulls will want to ride the wave and aim to re-enter the $500-level for the first time since June 2018. The IOMAP shows that ETH needs to overcome a moderate-to-strong resistance level at $380 before it can begin its charge.
Ethereum IOMAP
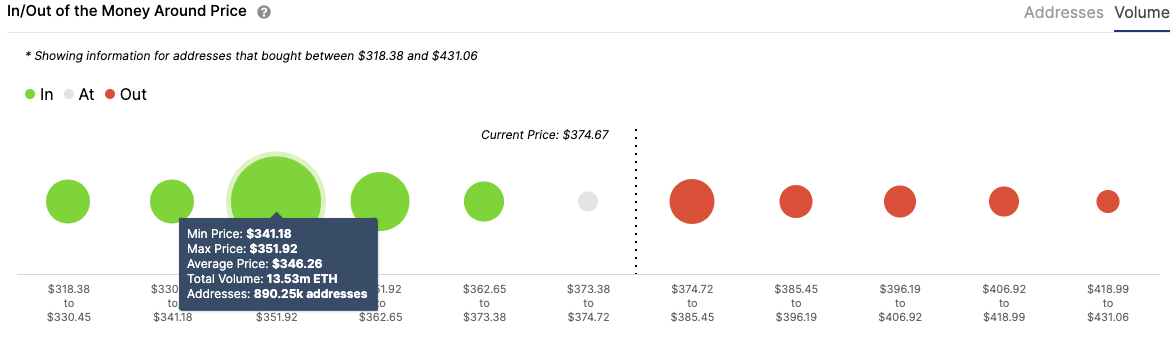
As per IntoTheBlock’s “In/Out of the Money Around Price” or IOMAP, 1.15 million addresses had previously purchased a little over 2 million ETH at this in the $380-level. The bullish outlook is further validated by Santiment’s holder’s distribution graph, which shows that the whales are currently strengthening their positions, which should spike buying pressure.
Ethereum holders distribution
 [08.45.37, 10 Oct, 2020]-637378984470513575.png)
As per the holders distribution chart, the number of addresses holding 100,000-1 million tokens went up by 5 over the last five days. Similarly, the addresses holding 10,000 - 100,000 tokens rose by 9 over the last two days. This is a very positive sign for the second-largest coin by market cap as it shows that the whales are consolidating their positions instead of just dumping their holdings.
Can the bears stage a comeback?
The bears can fight back if the price fails to close above the 50-day SMA. As per the IOMAP, this can trigger a pullback to the $355 support wall. If the bears manage to break below, they will face a massive support wall at the 100-day SMA ($345). These two walls should be strong enough to absorb any selling pressure, effectively capping the downside at the 100-day SMA.
Key levels to watch out for
Closing a candlestick above the 50-day SMA should initiate a charge towards the $485 resistance line. The downside for the bears is capped at the $355 support line and the 100-day SMA.
Author

Rajarshi Mitra
Independent Analyst
Rajarshi entered the blockchain space in 2016. He is a blockchain researcher who has worked for Blockgeeks and has done research work for several ICOs. He gets regularly invited to give talks on the blockchain technology and cryptocurrencies.


