Ethereum Price Prediction: ETH/USD may go down to $150 following price correction - Confluence Detector
- ETH/USD went down from $161 to $158 this Thursday.
- ETH/USD has no prominent support levels until $152.50.

Following this Tuesday’s spike where ETH/USD went up from $142 to $165, it has gone through two consecutive days of market correction. This Thursday, ETH/USD went down from $161 to $158. As per the daily confluence detector, ETH/USD has no prominent support levels until $152.50, which is why further drop is expected.
ETH/USD daily confluence detector
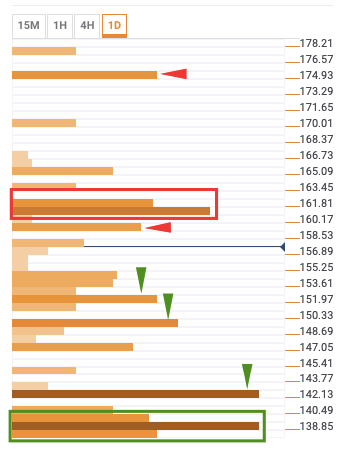
As per the ETH/USD daily confluence detector, prominent resistance levels lie at - $160, $160.50 - $162, and $175. The confluences at those levels are:
- $160: 5-day simple moving average (SMA 5), SMA 10, 4-hour Bollinger band middle curve, daily 23.6% Fibonacci retracement level, 15-min Previous high, and SMA 50.
- $160.50-$162: Hourly Bollinger band middle curve, SMA 5, monthly pivot point resistance 2, SMA 100, 4-hour previous high, and weekly pivot point resistance 3.
- $175: Monthly pivot point resistance 3.
The prominent support levels lie at - $152.50, $150, $143, and $137 - $140.50. The confluences at those levels are:
- $152.50: Monthly pivot point resistance 1.
- $150: Weekly pivot point resistance 1 and daily pivot point support 1.
- $143: Weekly 23.6% Fibonacci retracement level and monthly 23.6% Fibonacci retracement level.
- $137-$140.50: SMA 200, weekly 38.2% Fibonacci retracement level, SMA 50, monthly 38.2% Fibonacci retracement level, and 4-hour Bollinger band lower curve.
Author

Rajarshi Mitra
Independent Analyst
Rajarshi entered the blockchain space in 2016. He is a blockchain researcher who has worked for Blockgeeks and has done research work for several ICOs. He gets regularly invited to give talks on the blockchain technology and cryptocurrencies.


