Ethereum Price Forecast: ETH/USD risks a break below 200-HMA amid bearish RSI


  • ETH/USD bears await fresh impetus for the next leg down.
  • Path of least resistance is to the downside in the near-term.
  • The coin eyes $223.31 on a breach of key 200-HMA support.

Despite the latest drop, Ethereum (ETH/USD) remains confined within its $10 week-long trading range. The second-most widely traded crypto asset reverses more than half the late Saturday rally to $230.84, as sellers return amid thin volumes and minimal volatility so far this Sunday. The price seems exposed to an additional downside, as it now loses over 1% to trade around the $226.75 region. The spot enjoys a market capitalization of about $ 25.31 billion while it looks to settle the week 2% higher.

Short-term technical outlook

ETH/USD: Hourly chart

fxsoriginal


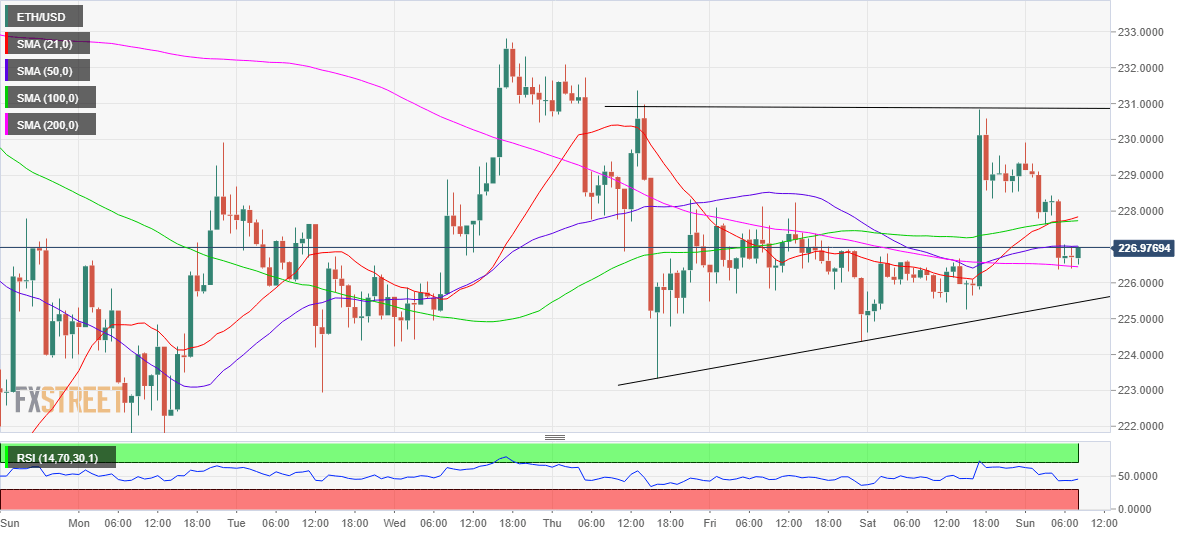
As observed in the hourly sticks, the no. 2 coin is challenging the key 200-hourly Simple Moving Average (HMA) support at $226.44. A break below the latter is inevitable given the hourly Relative Strength Index (RSI) holding below the 50 level, the bearish territory.


The immediate cushion for the ETH bulls awaits at the rising trendline support of $225.45. Selling pressure is likely to intensify below that level, opening floors for a test of Thursday’s low of $223.31, which could keep the buyers’ hopeful.

Meanwhile, the price faces immediate resistance at the horizontal 50-HMA of $227.02. Acceptance above the last could see the next barrier at $227.80 on the buyers’ radar. The 21 and 100-HMA coincide at the level.

Further north, the critical horizontal trendline resistance at $230.86 will be eyed. Note that Saturday’s high was at $230.84.

ETH/USD: Additional levels of note

ETH/USD

Overview
Today last price 226.74
Today Daily Change -2.57
Today Daily Change % -1.12
Today daily open 229.33
 
Trends
Daily SMA20 230.55
Daily SMA50 227.54
Daily SMA100 202.2
Daily SMA200 190.62
 
Levels
Previous Daily High 230.84
Previous Daily Low 224.62
Previous Weekly High 232.81
Previous Weekly Low 217.81
Previous Monthly High 253.48
Previous Monthly Low 216.37
Daily Fibonacci 38.2% 228.47
Daily Fibonacci 61.8% 227
Daily Pivot Point S1 225.68
Daily Pivot Point S2 222.04
Daily Pivot Point S3 219.46
Daily Pivot Point R1 231.91
Daily Pivot Point R2 234.49
Daily Pivot Point R3 238.13


Information on these pages contains forward-looking statements that involve risks and uncertainties. Markets and instruments profiled on this page are for informational purposes only and should not in any way come across as a recommendation to buy or sell in these assets. You should do your own thorough research before making any investment decisions. FXStreet does not in any way guarantee that this information is free from mistakes, errors, or material misstatements. It also does not guarantee that this information is of a timely nature. Investing in Open Markets involves a great deal of risk, including the loss of all or a portion of your investment, as well as emotional distress. All risks, losses and costs associated with investing, including total loss of principal, are your responsibility. The views and opinions expressed in this article are those of the authors and do not necessarily reflect the official policy or position of FXStreet nor its advertisers. The author will not be held responsible for information that is found at the end of links posted on this page.

If not otherwise explicitly mentioned in the body of the article, at the time of writing, the author has no position in any stock mentioned in this article and no business relationship with any company mentioned. The author has not received compensation for writing this article, other than from FXStreet.

FXStreet and the author do not provide personalized recommendations. The author makes no representations as to the accuracy, completeness, or suitability of this information. FXStreet and the author will not be liable for any errors, omissions or any losses, injuries or damages arising from this information and its display or use. Errors and omissions excepted.

The author and FXStreet are not registered investment advisors and nothing in this article is intended to be investment advice.

Join Telegram

Recommended content


Recommended Content

Editors’ Picks

PancakeSwap loses nearly 3% value intraday as the DEX crosses $1 billion in trade volume

PancakeSwap loses nearly 3% value intraday as the DEX crosses $1 billion in trade volume

Decentralized exchange (DEX) PancakeSwap (CAKE) announced in an official tweet that it has crossed $1 billion in trade volume on the Layer 2 chain, Base. CAKE on-chain metrics support the thesis of a recovery in the DEX token’s price. 

More Cryptocurrencies News

Shiba Inu hits new milestone, over $9 billion worth of SHIB tokens burnt

Shiba Inu hits new milestone, over $9 billion worth of SHIB tokens burnt

Shiba Inu (SHIB), the second-largest meme coin in the crypto ecosystem, recently hit a milestone in the volume of tokens burned. Shiba Inu has burnt over 410.72 trillion SHIB tokens since the inception of the burn mechanism in the project, worth over $9 billion.

More Shiba Inu News

Dogwifhat crashes 60%, but here's why you should not buy WIF yet Premium

Dogwifhat crashes 60%, but here's why you should not buy WIF yet

Dogwifhat (WIF) price shows a slowdown in the bearish momentum as it sets up a potential range. This development could lead to a good buying opportunity from a long-term perspective. 

More Dogwifhat News

XRP struggles to overcome $0.50 resistance, SEC vs. Ripple could enter final pretrial conference

XRP struggles to overcome $0.50 resistance, SEC vs. Ripple could enter final pretrial conference

XRP is struggling with resistance at $0.50 as Ripple and the US Securities and Exchange Commission (SEC) are gearing up for the final pretrial conference on Tuesday at a New York court. 

More Ripple News

Bitcoin: BTC’s rangebound movement leaves traders confused

Bitcoin: BTC’s rangebound movement leaves traders confused

Bitcoin (BTC) price has been hovering around the $70,000 psychological level for a few weeks, resulting in a rangebound movement. This development could lead to a massive liquidation on either side before a directional move is established. 

Read full analysis

BTC

ETH

XRP