Ethereum price analysis: ETH/USD lethargic above $220
- Ethereum momentum is mundane and limited by a descending trendline.
- Ethereum is inclined towards trending sideways in the short-term.

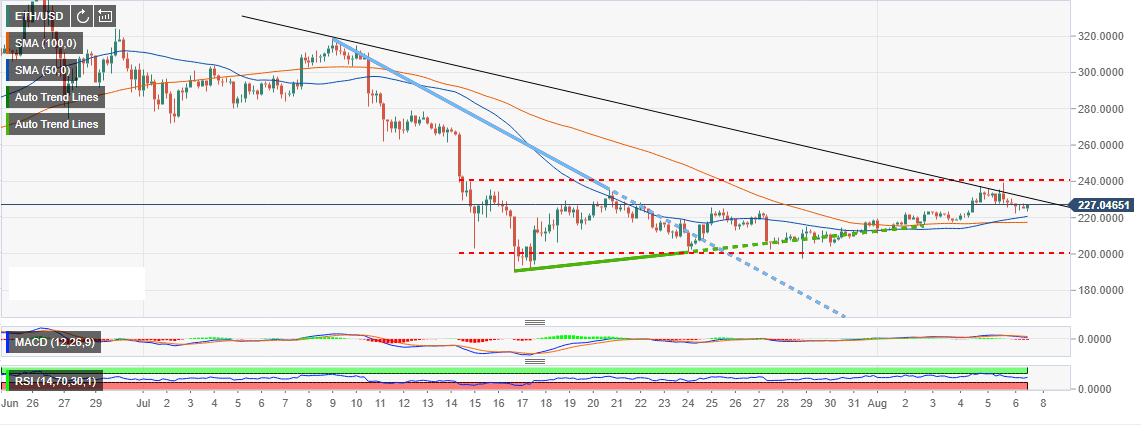
Ethereum brushed shoulders with $240 but failed to make headway towards $250 milestone. The uptrend started at the beginning of the week, was deep-rooted in the support at $200.
The gains from July 24 were massively enhanced following the break above the descending trendline from July highs around $320. Moreover, trading above the hour Moving Averages pulled Ethereum higher above the resistance at $220 and $230 respectively.
At press time, Ethereum momentum is mundane and limited by a descending trendline. The bears are pressing down on key support areas starting at $220. The 50 Simple Moving Average (SMA) is also in line to offer support within the same zone. At the same time, the 100 SMA 1-hour currently at $217 will prevent the price from exploring the levels heading to $200 vital support.
In a technical perspective, Ethereum is inclined towards trending sideways in the short-term. Looking at the Moving Average Convergence Divergence (MACD), the path of least resistance is sideways. However, if negative divergence rises, we can expect Ethereum to dive under $220. The same trend signal comes from the Relative Strength Index (RSI) which after retreating from levels around 70 is making a gradual recovery.
ETH/USD 1-hour chart
Author

John Isige
FXStreet
John Isige is a seasoned cryptocurrency journalist and markets analyst committed to delivering high-quality, actionable insights tailored to traders, investors, and crypto enthusiasts. He enjoys deep dives into emerging Web3 tren


