Ethereum Price Analysis: ETH/BTC drops below the downward trending line. Is the crypto market about to face massive bearish correction?
- The MACD line is on the verge of crossing over the signal line, indicating a reversal of bullish momentum.
- The Elliott Oscillator has had a second straight red session.

ETH/BTC daily chart
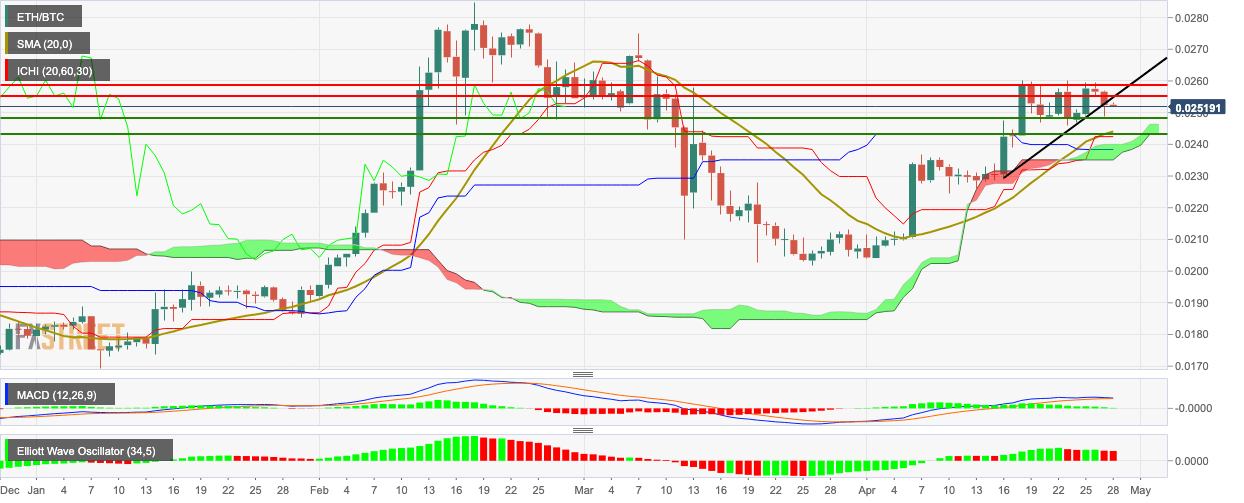
ETH/BTC fell from 0.0253 to 0.0252, as bears remained in control for the third consecutive day. In the process, the price has broken below the support provided by the upward trending line. Since the ETH/BTC chart is a good indicator of the current health of the crypto market, the price dropping below the upward trending line could be a precursor of the market as a whole facing heavy bearish correction today. The bears will be targeting the 0.0248 and 0.0243 support lines. The latter will take the price below the SMA 20 and into the green Ichimoku cloud. The MACD line is on the verge of crossing over the signal line, indicating a reversal of bullish momentum, while the Elliott Oscillator has had two consecutive red sessions.
Key levels
Author

Rajarshi Mitra
Independent Analyst
Rajarshi entered the blockchain space in 2016. He is a blockchain researcher who has worked for Blockgeeks and has done research work for several ICOs. He gets regularly invited to give talks on the blockchain technology and cryptocurrencies.


