Ethereum price analysis: Bearish indicators and key levels to watch

Summary
Ethereum (ETH) has been making lower highs and lows recently, signaling potential for more downside. Technical and on-chain indicators are predominantly bearish at the moment, especially after the price broke the significant $1,650 support level. Here's what traders need to know.
Key points
-
Technical Analysis: Ethereum's daily and 4-hour charts show bearish signals.
-
Key Levels: $1,650 and $2,000 are critical support and resistance levels, respectively.
-
On-Chain Metrics: The taker buy-sell ratio has been trending in the negative region, indicating bearish sentiment in the futures market.
In-depth analysis
Technical Indicators Point to Downside:
The daily chart
The daily chart has shown a recent bearish crossover between the 50-day and 200-day moving averages, which is generally a sign of a long-term downtrend. The price recently broke below the $1,650 support and is currently retesting it.
The 4-hour chart
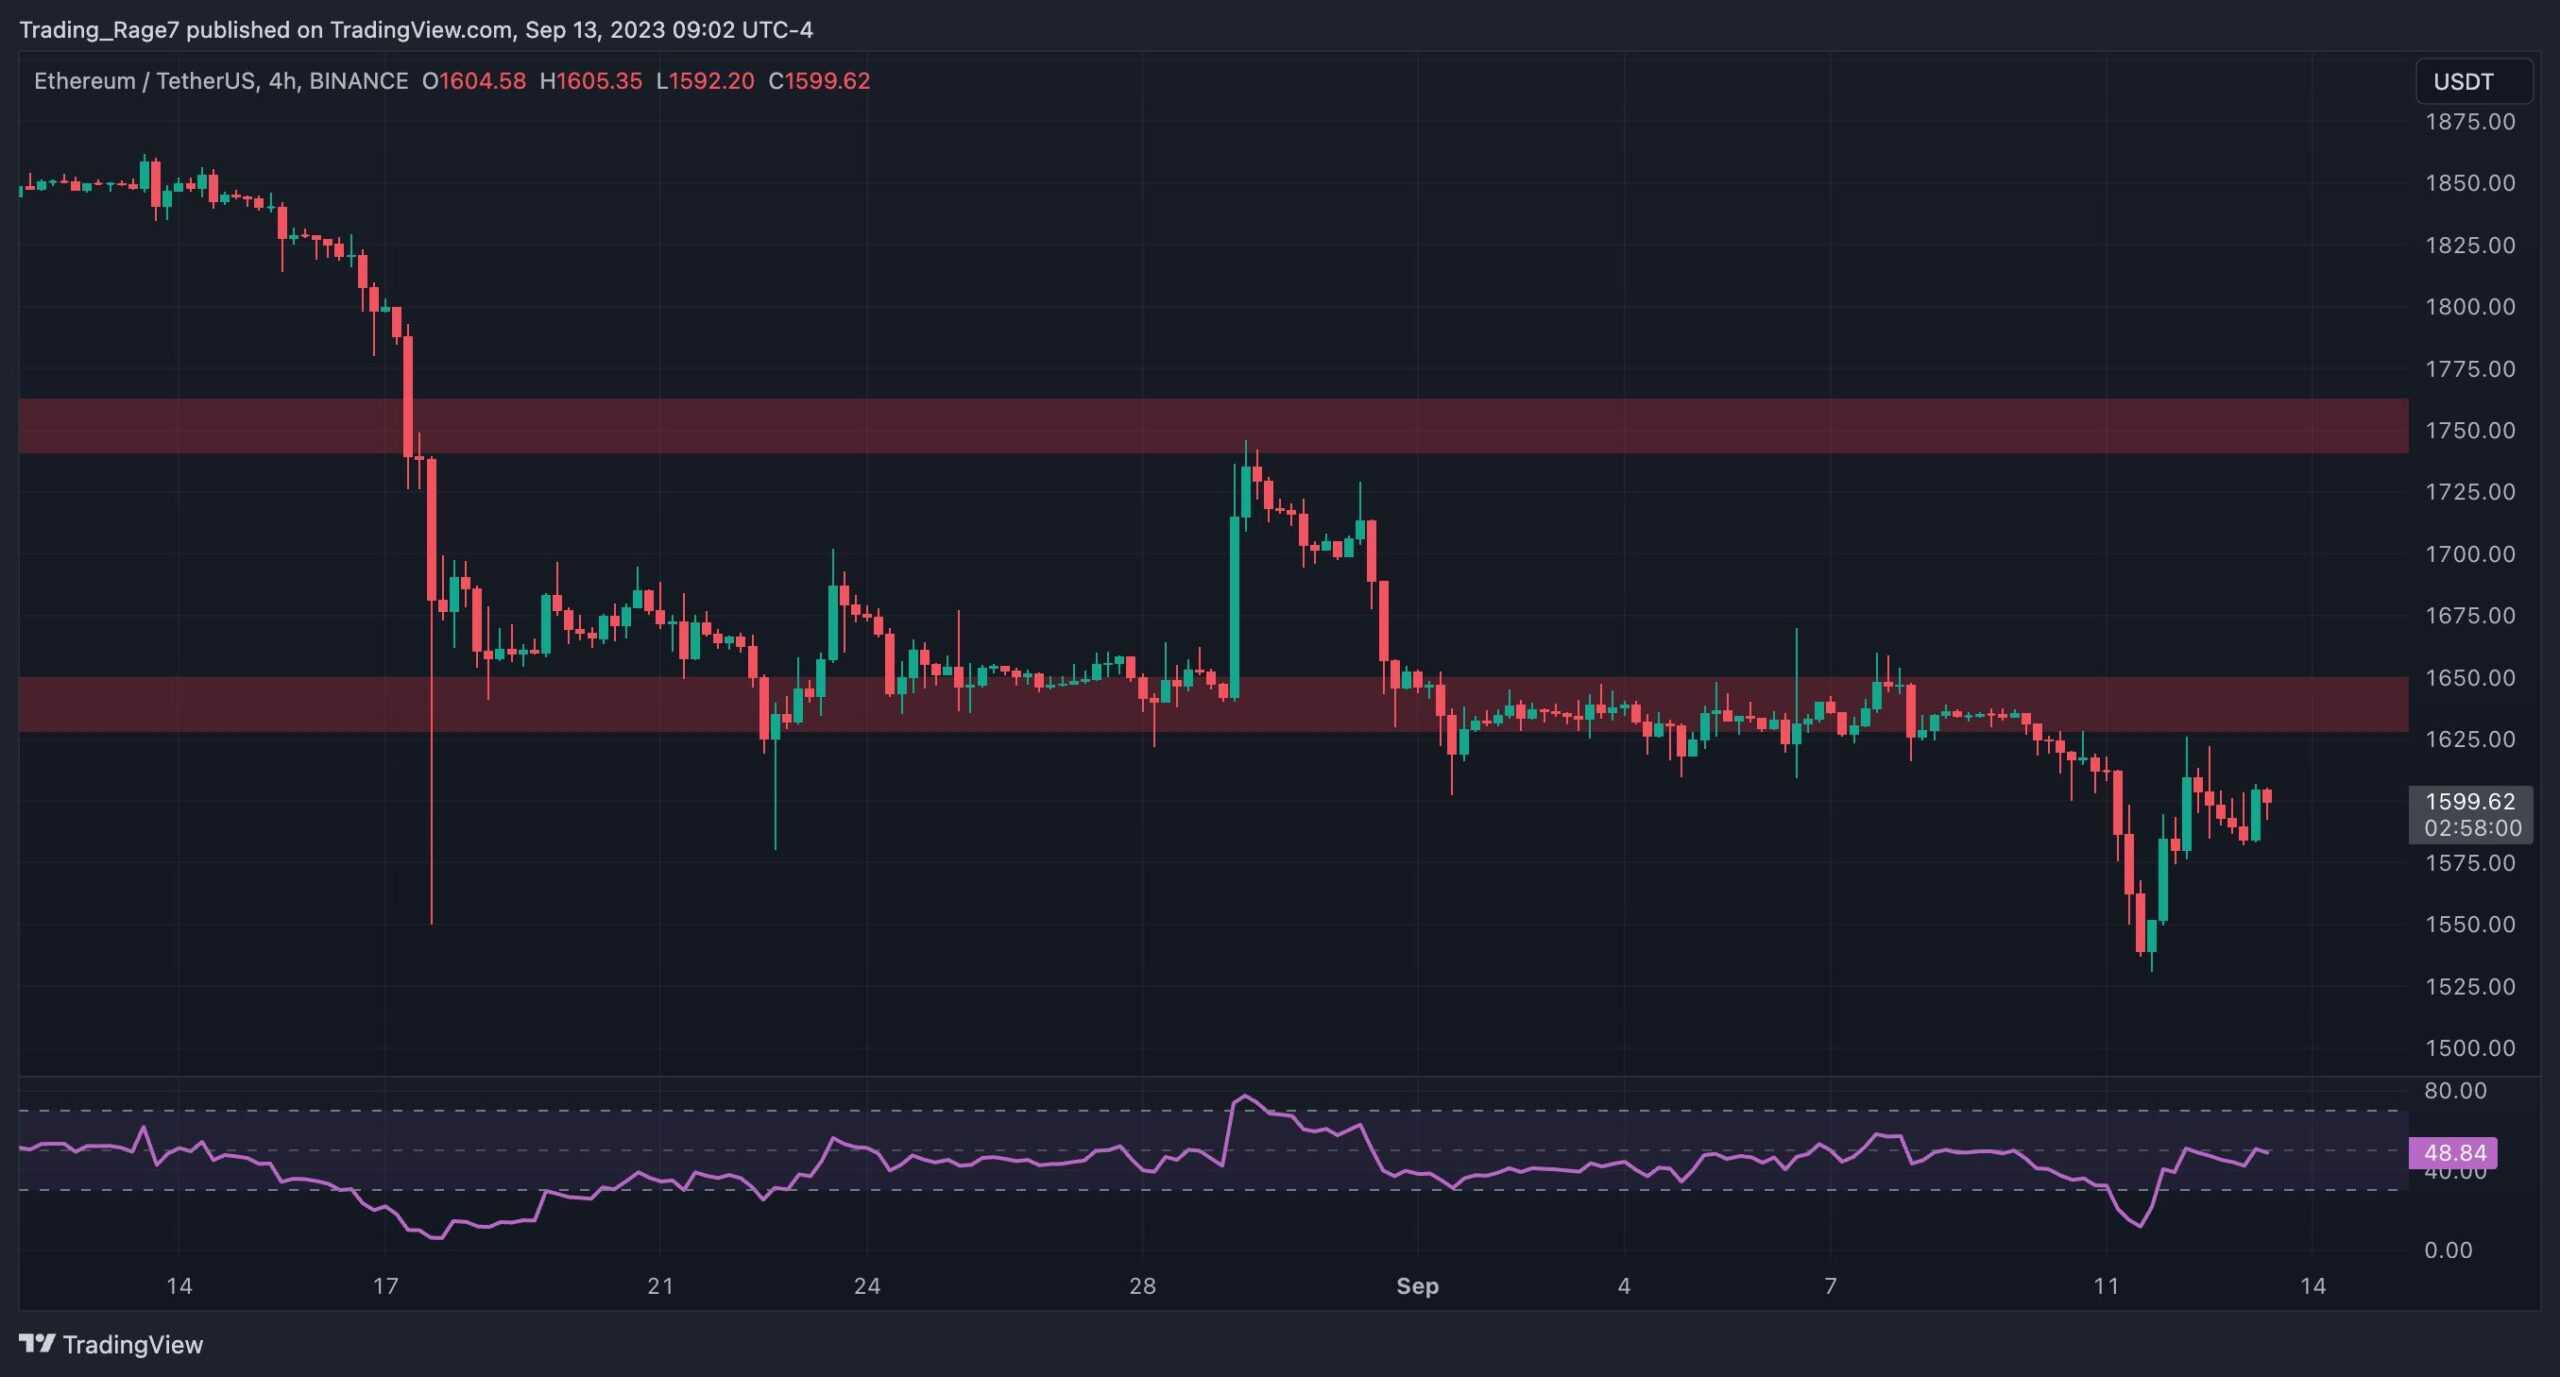
The 4-hour chart shows that after weeks of testing, the price has broken through the $1,650 support zone and is pulling back towards it. A rally to $1,750 could be in play if the price moves above this level. Otherwise, a more significant decline is likely.
On-Chain analysis
Ethereum Taker Buy Sell Ratio:
The metric has been in the negative region over the past few months, implying that futures market sentiment is bearish on Ethereum. As long as this is the case, a bullish reversal in the short term seems unlikely.
Trading strategies
-
Bearish Outlook: Traders with a bearish outlook might consider short positions, especially if the price fails to move back above the $1,650 level. Stop-losses could be placed above $1,750 to minimize risk.
-
Neutral/Bullish Outlook: Traders who are either neutral or slightly bullish might want to wait for a clear break above $1,650 and hold for the target at $1,750. A stop-loss could be placed below the $1,650 level.
-
Long-Term Bulls: If you're a long-term bull on Ethereum, this could be an opportunity to accumulate at a lower price, though the risk of further downside remains.
Conclusion:
Given the bearish technical and on-chain indicators, Ethereum’s price faces a high probability of further downside. The $1,650 level is the key level to watch, both as a resistance and potential flip to support. While there may be short-term rallies, the overall sentiment appears bearish, as reflected by the taker buy-sell ratio in the futures market.
Author

Usman Ahmed
Forex92
Usman Ahmed is a currency trader and financial market analyst with more than a decade of active trading experience.


