|

Ethereum price aims for $520 if bulls can crack this critical resistance level

  • Ethereum price is bounded inside an ascending parallel channel.
  • The upper boundary of the pattern is a crucial resistance level.
  • Bulls are aiming to hit $520 if they can crack the upper trendline at $485. 

Ethereum is currently trading at $461, bounded inside an ascending parallel channel on the hourly chart. The digital asset looks poised to test the upper trendline at $485. A breakout above this point can quickly drive Ethereum price towards $520.

Ethereum bulls eying up $520 

The current hourly ascending parallel channel is the most significant pattern in the short-term. The upper trendline at $485 has acted as a healthy resistance level since November 7. Ethereum price is currently in the middle of the pattern and above the 100-SMA.

eth price

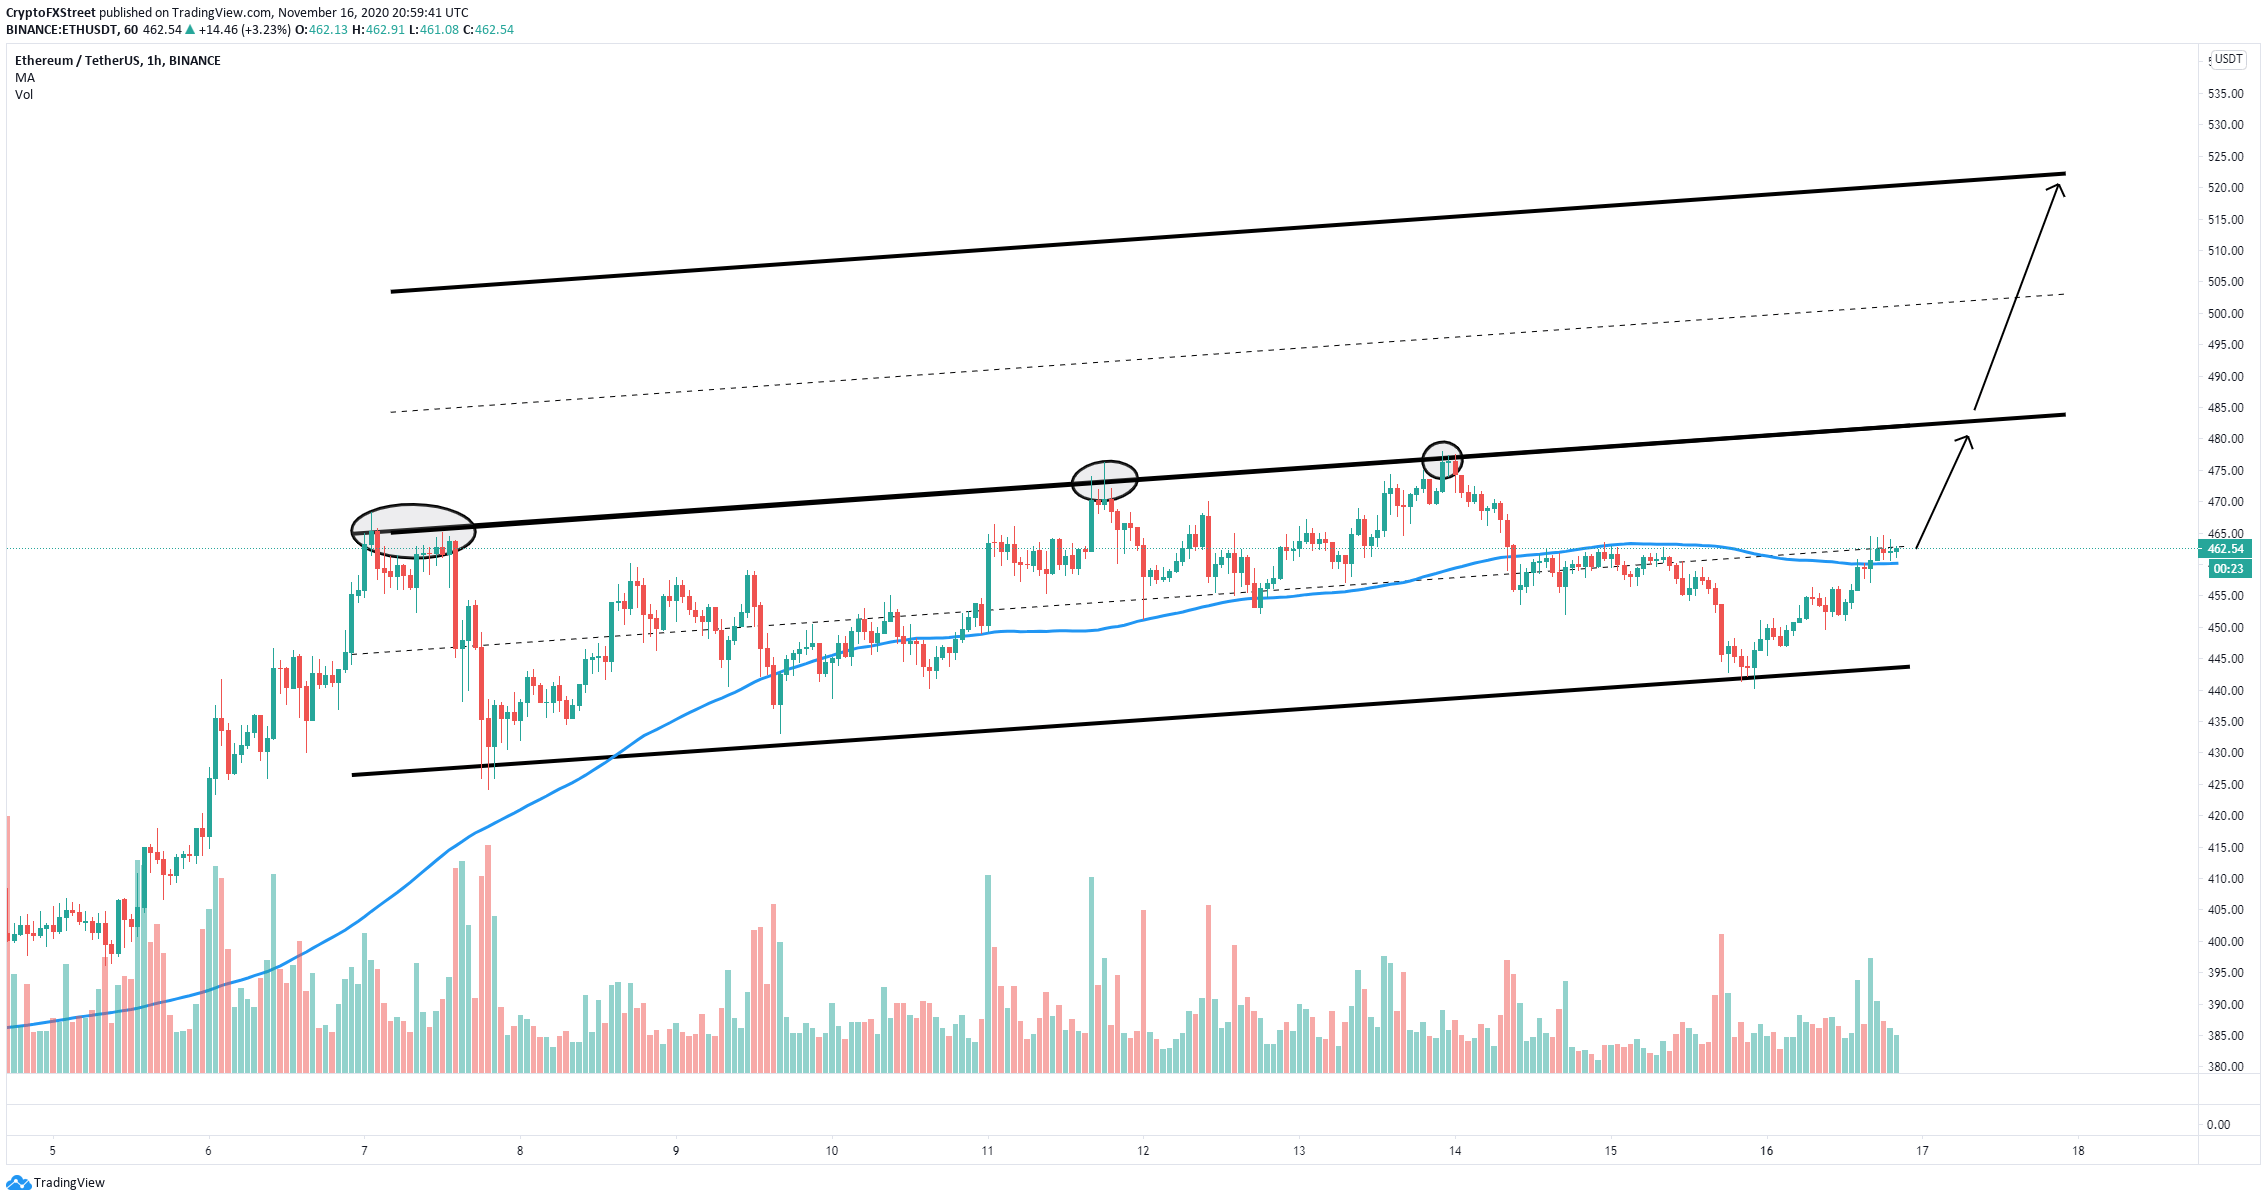
ETH/USD 1-hour chart

Ethereum looks poised to climb towards $485 after conquering the 100-SMA as a support level for the first time since November 14. A breakout above the upper trendline would be significant and likely to drive ETH towards $520, using the pattern's height.
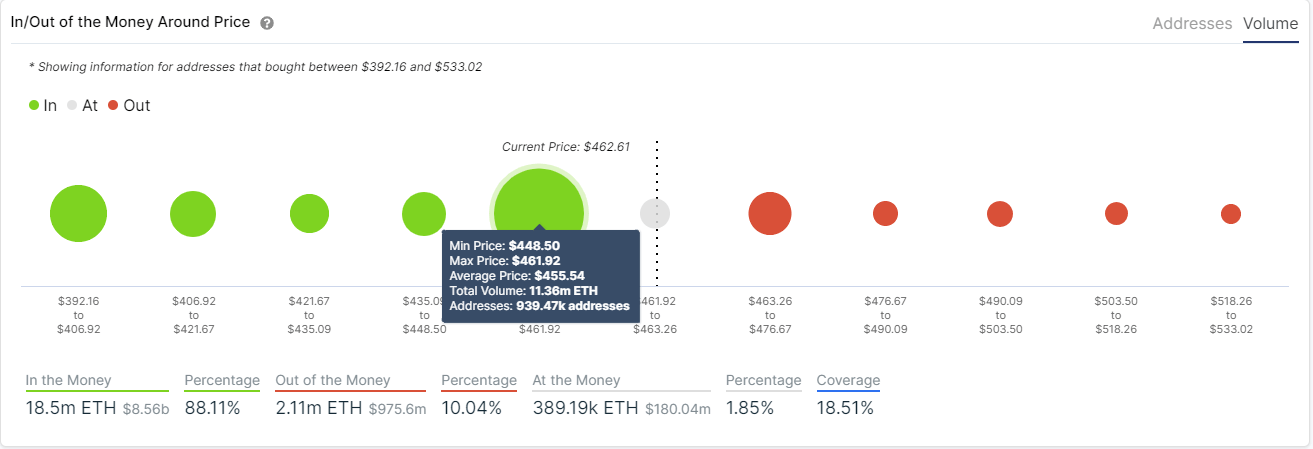
eth price

ETH IOMAP chart

The In/Out of the Money Around Price chart certainly seems to favor the bulls, showing a robust support area between $488 and $461 but almost no resistance ahead, well until $533. This adds strength to the bullish outlook. 

The bulls' most prominent issue in the short-term is not getting stopped by the middle trendline of the parallel channel. A loss of the 100-SMA would also be notable and could push Ethereum price towards the lower boundary of the pattern at $443. 

Author

Lorenzo Stroe

Lorenzo Stroe

Independent Analyst

Lorenzo is an experienced Technical Analyst and Content Writer who has been working in the cryptocurrency industry since 2012. He also has a passion for trading.

More from Lorenzo Stroe
Share:

Editor's Picks

Hyperliquid Price Forecast: HYPE rises on commodities demand amid US-Iran war

Hyperliquid (HYPE) steadies above $33 at press time on Tuesday, marking its fourth consecutive day of recovery in a broadly volatile market due to the ongoing US-Israel strikes on Iran.

Stellar Price Forecast: XLM risks deeper losses as derivatives metrics turn negative

Stellar is trading red below $0.16 at the time of writing, after a slight recovery the previous day. Weakening derivatives data caps the recovery, while an unfavorable technical outlook projects a deeper correction for the XLM token in the upcoming days.

Aave Price Forecast: AAVE tests channel resistance as ParaFi Capital deposit, bearish derivatives data caps upside

Aave (AAVE) trades around $120 on Tuesday, testing the channel resistance, signaling that sellers remain active in the zone. Lookonchain data shows that ParaFi Capital transferred 42,000 AAVE tokens to Coinbase Prime over the past 10 hours, often interpreted as a potential selling signal.

CME Group's futures suite now covers over 75% of total crypto market cap

CME Group announced that its crypto futures offering now covers over 75% of the total digital asset market cap, following the launch of its Cardano (ADA), Chainlink (LINK) and Stellar (XLM) products.

Bitcoin Price Annual Forecast: BTC holds long-term bullish structure heading into 2026

Bitcoin (BTC) is wrapping up 2025 as one of its most eventful years, defined by unprecedented institutional participation, major regulatory developments, and extreme price volatility.

Bitcoin: Another month of losses, and it’s been five

Bitcoin (BTC) price is stabilizing around $68,000 at the time of writing on Friday, but the Crypto King is poised to close February on a fragile footing, marking its fifth consecutive month of losses since October and a rare start to the year with back-to-back monthly corrections.