|

Ethereum Classic Technical Analysis: ETC/USD bulls and bears wrestle for control in the short-term

  • ETC/USD daily chart has had three straight bullish seasons.
  • The buyers failed to gather enough steam to cross the $6.50-level.

ETC/USD hourly chart

ETC/USD hourly chart

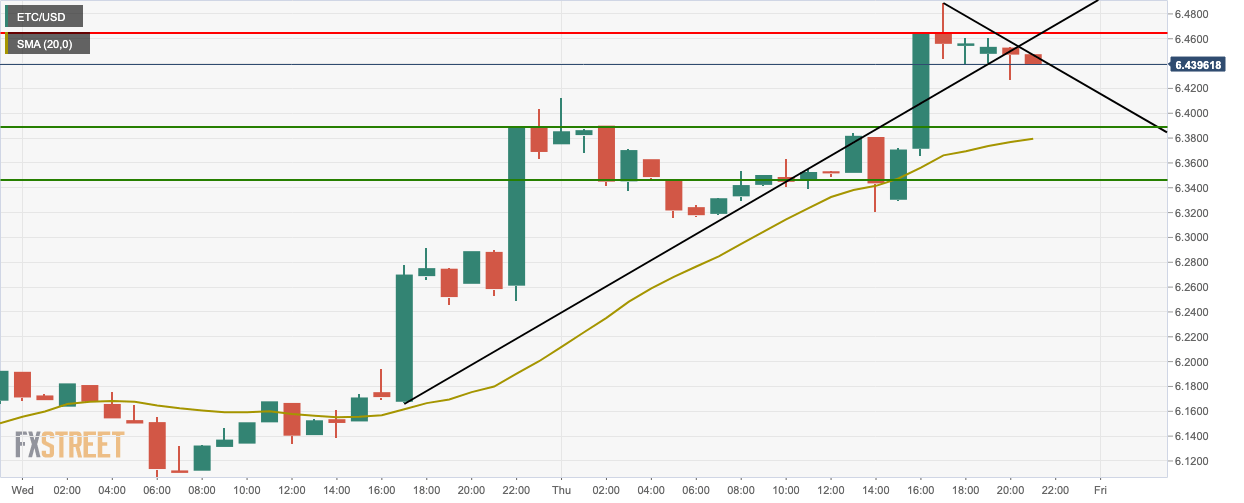
The hourly ETC/USD chart shows us that the price encountered massive resistance at $6.46 after losing momentum near the $6.50 level. Since then, ETC/USD has progressively dropped down. The hourly price has fallen below the triangle formation and is currently facing resistance at the downward trending line.

ETC/USD daily chart

ETC/USD daily chart

While ETC/USD buyers and sellers are playing a game of tag in the hourly chart, the daily chart belongs solely to the bulls. After encountering support at the $6.04-level, the price has managed three straight bullish sessions. ETC/USD has gone up from $6.375 to $6.44 this Thursday and is trending in an upward channel formation. The price has strong resistance at $6.505 and $6.64. On the downside, we have healthy support at $6.26 and $6.1275.

Key Levels

ETC/USD

Overview
Today last price6.4509
Today Daily Change0.0820
Today Daily Change %1.29
Today daily open6.3689
 
Trends
Daily SMA206.1848
Daily SMA506.2672
Daily SMA1006.3323
Daily SMA2006.994
 
Levels
Previous Daily High6.404
Previous Daily Low6.1079
Previous Weekly High6.5666
Previous Weekly Low5.9102
Previous Monthly High7.3282
Previous Monthly Low5.4387
Daily Fibonacci 38.2%6.2909
Daily Fibonacci 61.8%6.221
Daily Pivot Point S16.1832
Daily Pivot Point S25.9975
Daily Pivot Point S35.887
Daily Pivot Point R16.4793
Daily Pivot Point R26.5897
Daily Pivot Point R36.7754

Since you are here, do check out our cryptocurrency market news report to get a quick overview of which coins are hot and which are not.

Author

Rajarshi Mitra

Rajarshi Mitra

Independent Analyst

Rajarshi entered the blockchain space in 2016. He is a blockchain researcher who has worked for Blockgeeks and has done research work for several ICOs. He gets regularly invited to give talks on the blockchain technology and cryptocurrencies.

More from Rajarshi Mitra
Share:

Editor's Picks

Ripple bulls defend key support amid waning retail demand and ETF inflows

XRP ticks up above $1.40 support, but waning retail demand suggests caution. XRP attracts $4 million in spot ETF inflows on Thursday, signaling renewed institutional investor interest.

Crypto Today: Bitcoin, Ethereum, XRP rebound as risk appetite improves

Bitcoin rises marginally, nearing the immediate resistance of $68,000 at the time of writing on Friday. Major altcoins, including Ethereum and Ripple, hold key support levels as bulls aim to maintain marginal intraday gains.

Bitcoin Weekly Forecast: No recovery in sight 

Bitcoin price continues to trade sideways between $65,729 and $71,746, extending its consolidation since February 7. US-spot ETFs record an outflow of $403.90 million through Thursday, pointing to the fifth consecutive week of withdrawals.

Pi Network Price Forecast: PI recovery stalls amid profit-taking

Pi Network tests 50-day EMA support on Friday, after a 5% decline the previous day. PiScan data shows large deposits on CEXs totaling over 4 million PI tokens in the last 24 hours, reflecting an exodus of investors taking profits.

Bitcoin Price Annual Forecast: BTC holds long-term bullish structure heading into 2026

Bitcoin (BTC) is wrapping up 2025 as one of its most eventful years, defined by unprecedented institutional participation, major regulatory developments, and extreme price volatility.

Bitcoin: No recovery in sight

Bitcoin (BTC) price continues to trade within a range-bound zone, hovering around $67,000 at the time of writing on Friday, and falling slightly so far this week, with no signs of recovery.