Ethereum Classic price to restore bullish forecasts, as ETC trades above $47
- Ethereum Classic price is energized today, carrying a 7.5% gain and pushing above the enduring resistance of the 2018 high.
- The ETC 50-day simple moving average (SMA) at $50.10, creating instant resistance for the developing rally from July 21.
- The midline of the descending parallel channel is dominant support if the breakout above $46.98 reverses.

Ethereum Classic price shows a gain of over 17% for the week but still carries a loss of 14.7% for the month. If the current breakout above the 2018 high of $46.98 sticks, ETC faces only the 50-day SMA on a path to the upper line of the descending parallel channel. For now, the outlook remains neutral until Ethereum Classic price can close above $46.98.
Ethereum Classic price may be starting its engines, but only time will tell
Today, Ethereum Classic price is attempting to knock out two resistance levels, the 2018 high at $46.98 and the 50-day SMA at $50.10, but the effort is fading as today progresses. The ETC move is supported by above-average volume, unlike the previous three days of the new rally.
The magnitude of the new ETC rally originating on July 21 is 23%, putting it well below the four-day burst in late June of 44% and the 43% gain at the end of May, thereby questioning the impulsiveness of the current rebound and Ethereum Classic price sustainability.
A successful close above the 2018 high and 50-day SMA today would release Ethereum Classic price to test the upper line of the descending parallel channel at $56.30, followed by the June 30 high of $62.45. There is no further resistance until the grouping of the 38.20% Fibonacci retracement of the May-June correction at $80.75 and the May 26 high of $84.09, presenting an intriguing 68% gain for ETC investors.
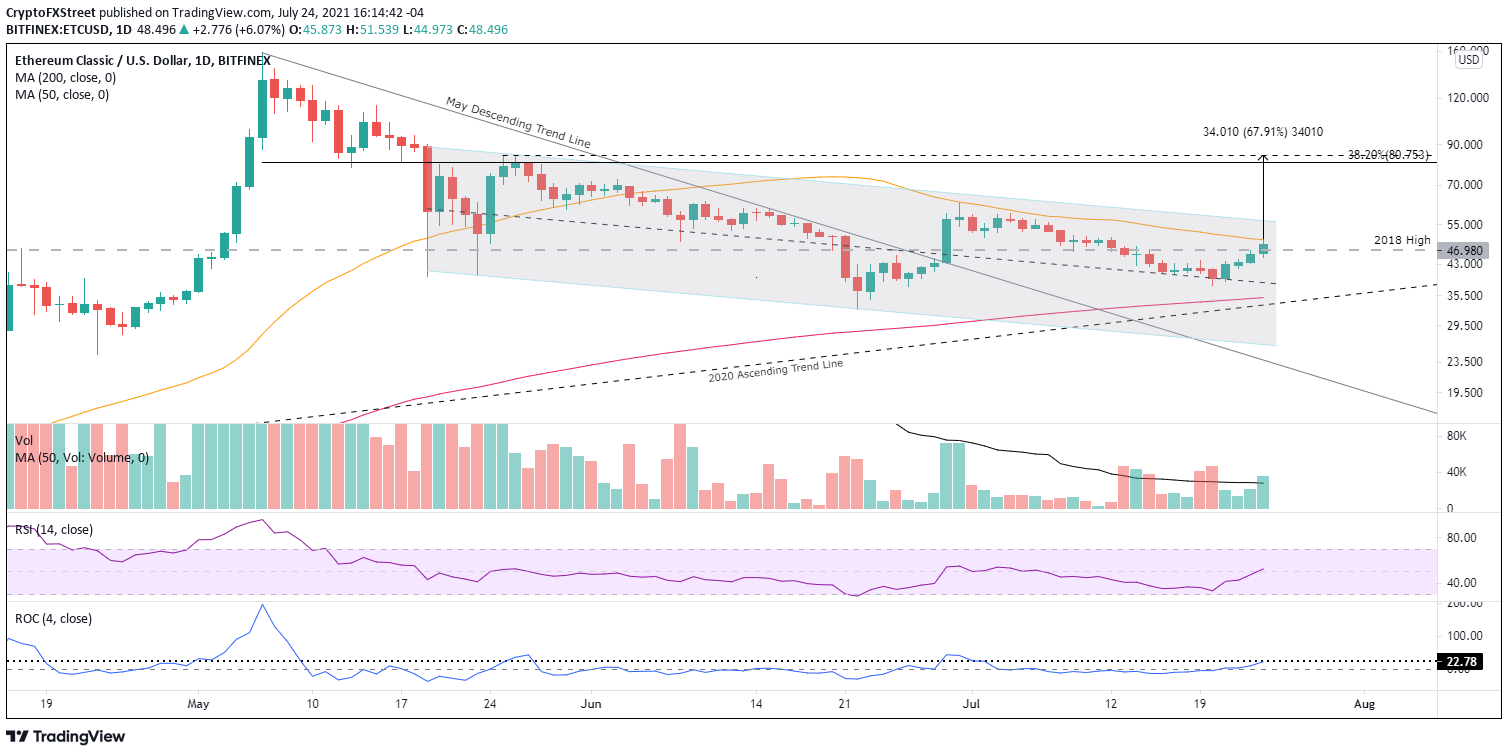
ETC/USD daily chart
If Ethereum Classic price fails to hold $46.98 today, it invites a retracement of the rally to the midline of the descending parallel channel at $38.19, the beginning of the rebound. A daily close below the midline would imply lower prices, but the sustainability of the drop may be short-lived as ETC has only closed one week below the channel since the May plunge.
Additional support lies at the near convergence of the 200-day SMA at $35.05 with the 2020 ascending trend line at $33.33 and reinforced by the June 22 low of $32.53. Any further weakness will attract support at the lower line of the descending parallel channel at $26.10, generating a loss of 32% from the channel’s midline.
Ethereum Classic price is in a better technical position than many of the cryptocurrencies. It is trading well above the 50-week SMA and the 200-day SMA, two strategically important moving averages. Moreover, ETC is not negatively influenced by a bearish Death Cross pattern, when the 50-day SMA crosses below the 200-day SMA, or the resistance attributed to the June 22 low.
Trading today suggests that Ethereum Classic price has started its engine, but only a close above $46.98 will restore bullish forecasts and energize ETC to pursue a rally to the 38.2% retracement.
Here, FXStreet's analysts evaluate where ETC could be heading next as it seems bound for a small pull back before the breakout.
Author

Sheldon McIntyre, CMT
Independent Analyst
Sheldon has 24 years of investment experience holding various positions in companies based in the United States and Chile. His core competencies include BRIC and G-10 equity markets, swing and position trading and technical analysis.


