Ethereum Classic Price Analysis: ETC/USD bulls fail near the $7-level
- ETC/USD bulls ran out of style near the SMA 200 curve.
- MACD shows sustained bearish momentum.

ETC/USD daily chart
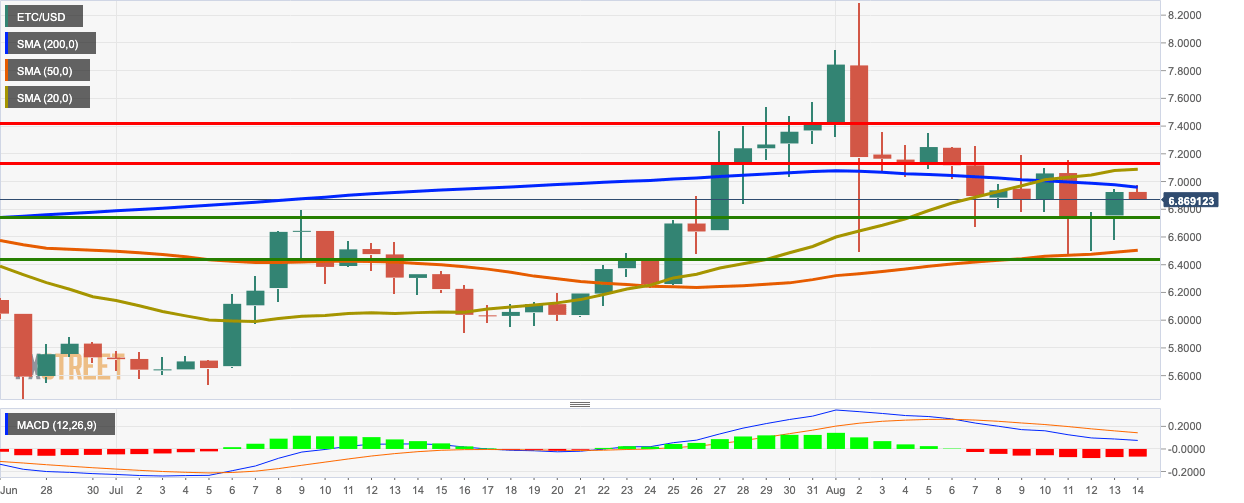
ETC/USD faced bearish correction following two straight bullish sessions. The price dropped from $6.925 to $6.889. The moving average convergence/divergence (MACD) shows sustained bearish market momentum.
There are four strong resistance levels at $6.96 (SMA 200), $7.09 (SMA 20), $7.143 and $7.41. On the downside, we have three healthy support levels at $6.75, $6.515 (SMA 50) and $6.45.
Author

Rajarshi Mitra
Independent Analyst
Rajarshi entered the blockchain space in 2016. He is a blockchain researcher who has worked for Blockgeeks and has done research work for several ICOs. He gets regularly invited to give talks on the blockchain technology and cryptocurrencies.
More from Rajarshi Mitra


