Ethereum Classic Price Analysis: ETC bides time before the next upswing kicks in
- ETC price is stuck in a tight range between two key Fibo levels on the 12H chart.
- Overbought conditions warrant caution but the coin defends key support so far.
- Ethereum classic awaits fresh impetus for the next direction.

ETC/USD is lacking a clear directional bias so far this Saturday, licking its wounds after extending the corrective decline from lifetime highs of $184.81.
With retail investors looking for undervalued investment alternatives after the meteoritic rise in Bitcoin, Dogecoin, Ethereum among other cryptocurrencies, Ethereum Classic rose nearly 50% on Thursday, reaching the highest level on record.
The bulls took a breather thereafter, as the ETC price retraced nearly half the rally to record highs.
ETC/USD: Where are the prices headed next?
As observed on Ethereum Classic’s 12-hour chart, the price has managed to defend key support near the $111 mark, which is the 50% Fibonacci Retracement level of nearly 300% rally seen so far this month.
Despite Friday’s sharp sell-off, ETC bulls recaptured the latter to settle the day at $119.91. At the time of writing, the coin is up nearly 1%, trading around $121 levels.
The price has formed a doji candlestick on the said time frame, suggesting that the bulls and bears appear to be fighting for control.
The 61.8% Fibonacci level of the same upsurge at $127.20 is limiting any upside attempt in the spot.
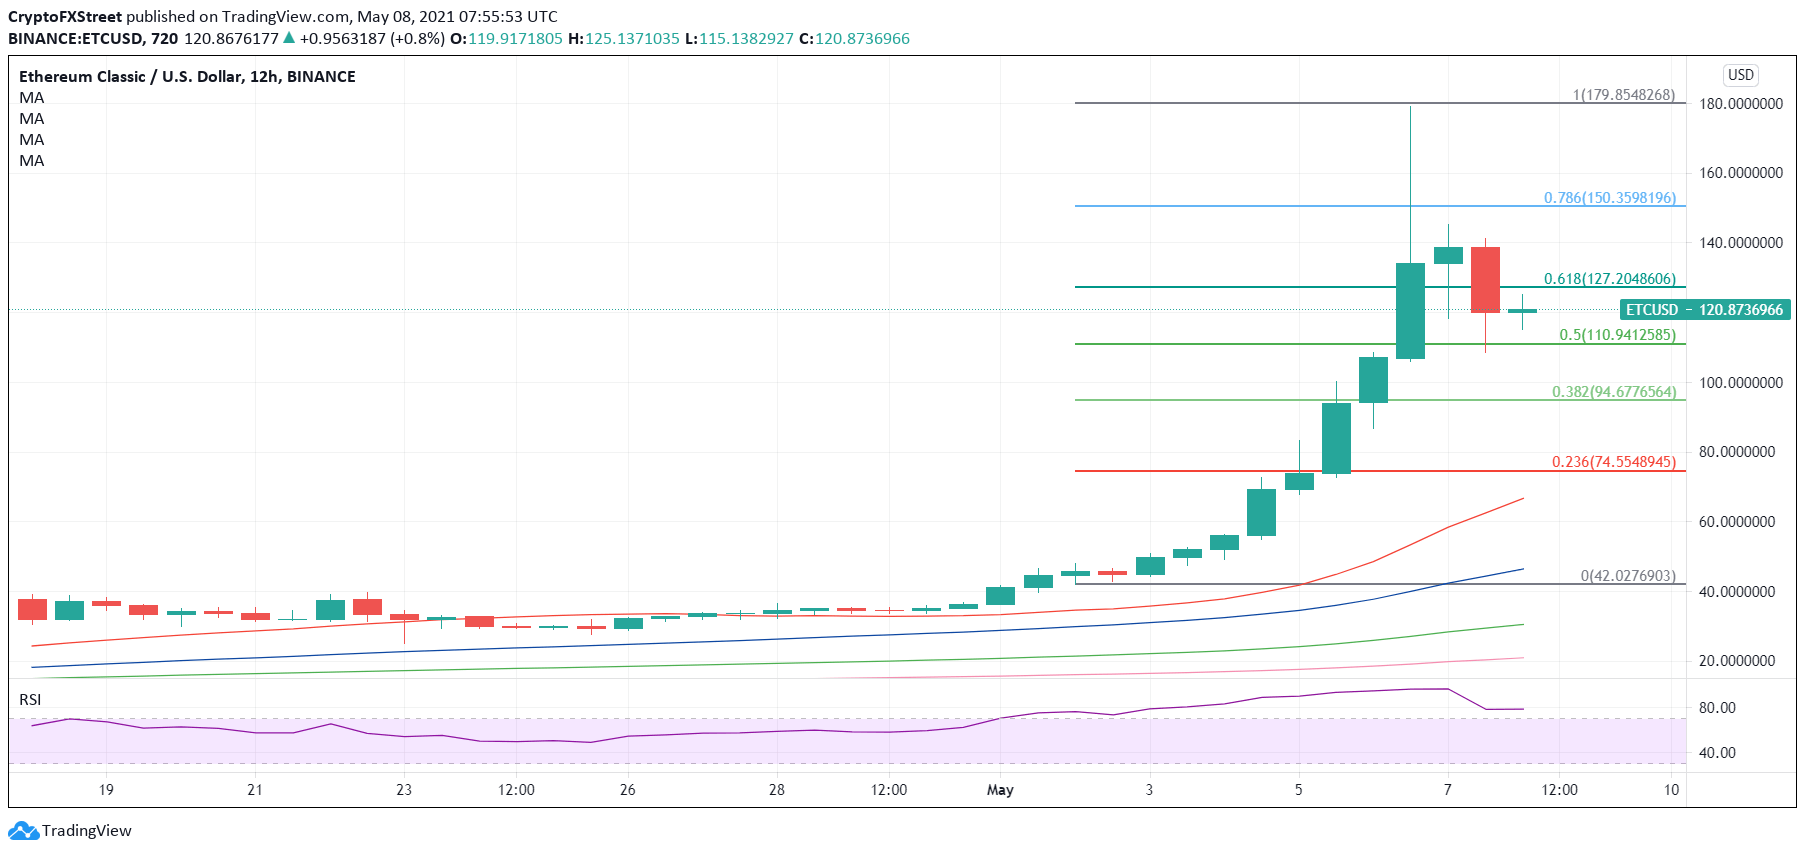
ETC/USD: 12-hour chart
Amid the range play, traders are awaiting a strong catalyst for the next direction in prices.
However, with the relative strength index (RSI) hovering within the overbought territory, the ETC bulls remain cautious.
The corrective downside could regain traction only a 12-hour candlestick closing below the 50% Fibo level, which is likely to expose the $100 psychological level.
The next downside target is envisioned around the $94-84 region, which is the confluence of Thursday’s low and 38.2% Fibo level.
Alternatively, acceptance above the 61.8% Fibo level could reinforce the bullish momentum, with eyes once again on the $150 barrier. At that level, the 78.6% Fibo level coincides.
A sustained break above the latter could put the all-time highs at risk.
ETC/USD: Additional levels to watch
Author

Dhwani Mehta
FXStreet
Residing in Mumbai (India), Dhwani is a Senior Analyst and Manager of the Asian session at FXStreet. She has over 10 years of experience in analyzing and covering the global financial markets, with specialization in Forex and commodities markets.


