Ethereum breaks 3000 in bullish wave 3 after weekend gap
-
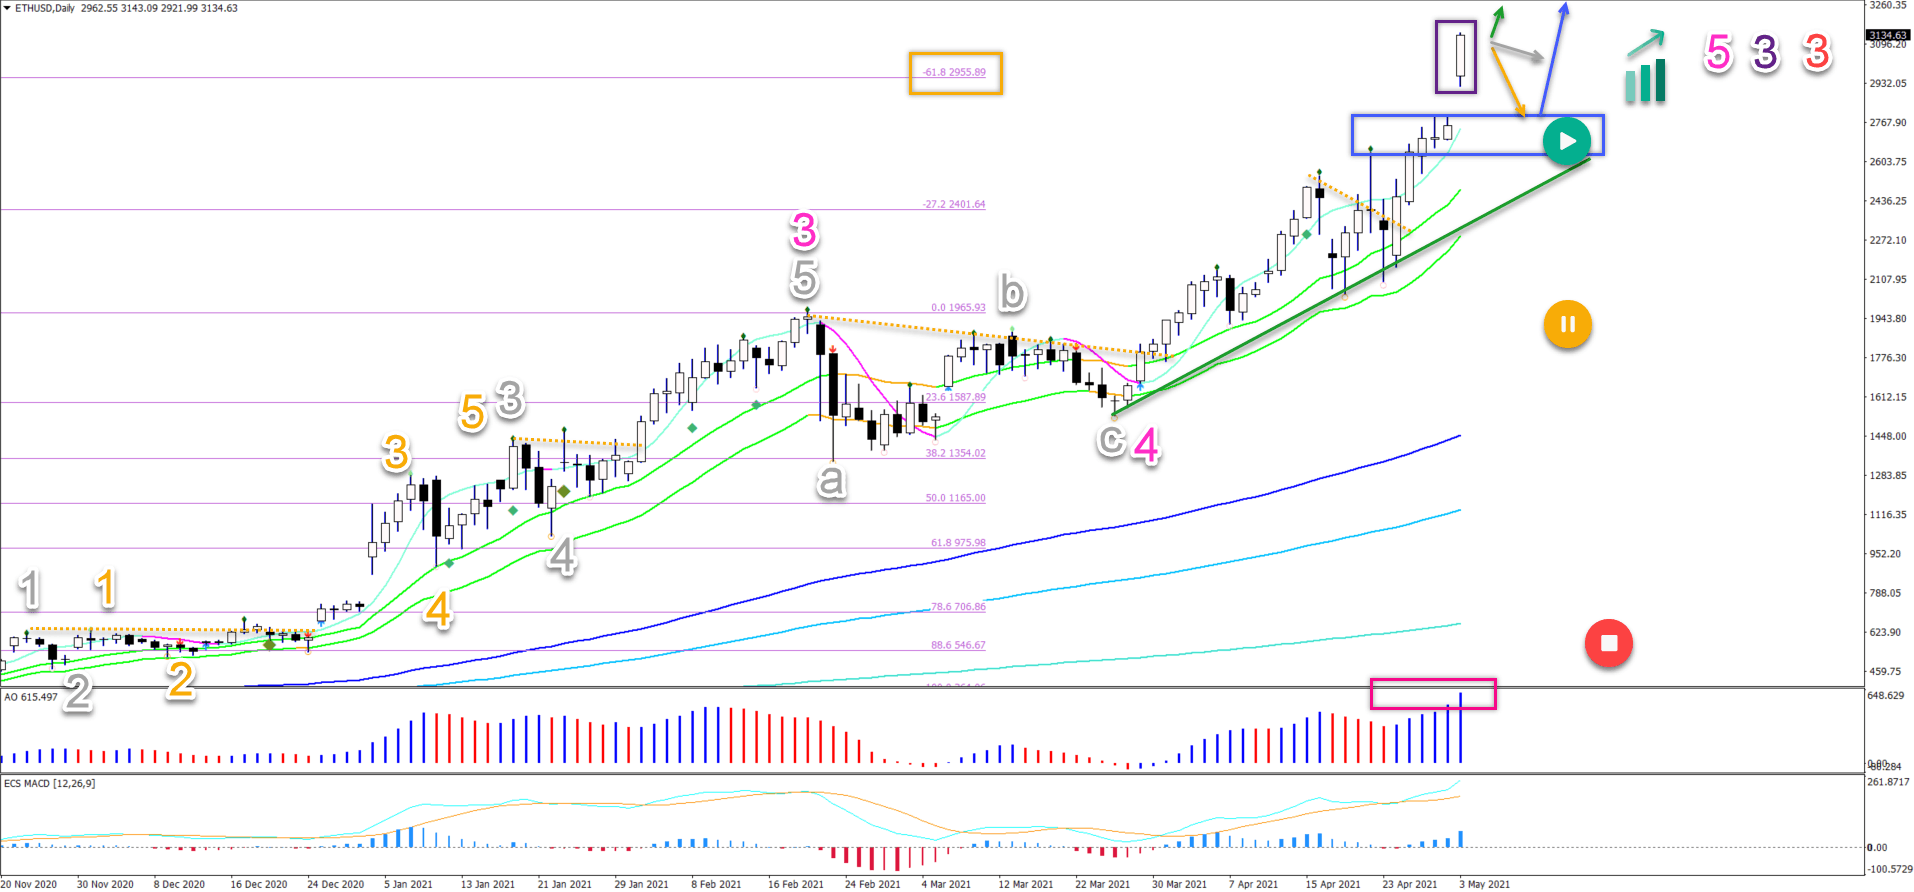
Ethereum's daily chart is showing massive bullish momentum. The break away from the moving averages is strong and the angle of the 21 emas and 20 hma is steep.
-
The ETH/USD gapped higher over the weekend. The price action reached is now passing the -61.8% Fibonacci target (orange) after bouncing at the 38.2% Fibonacci.
-
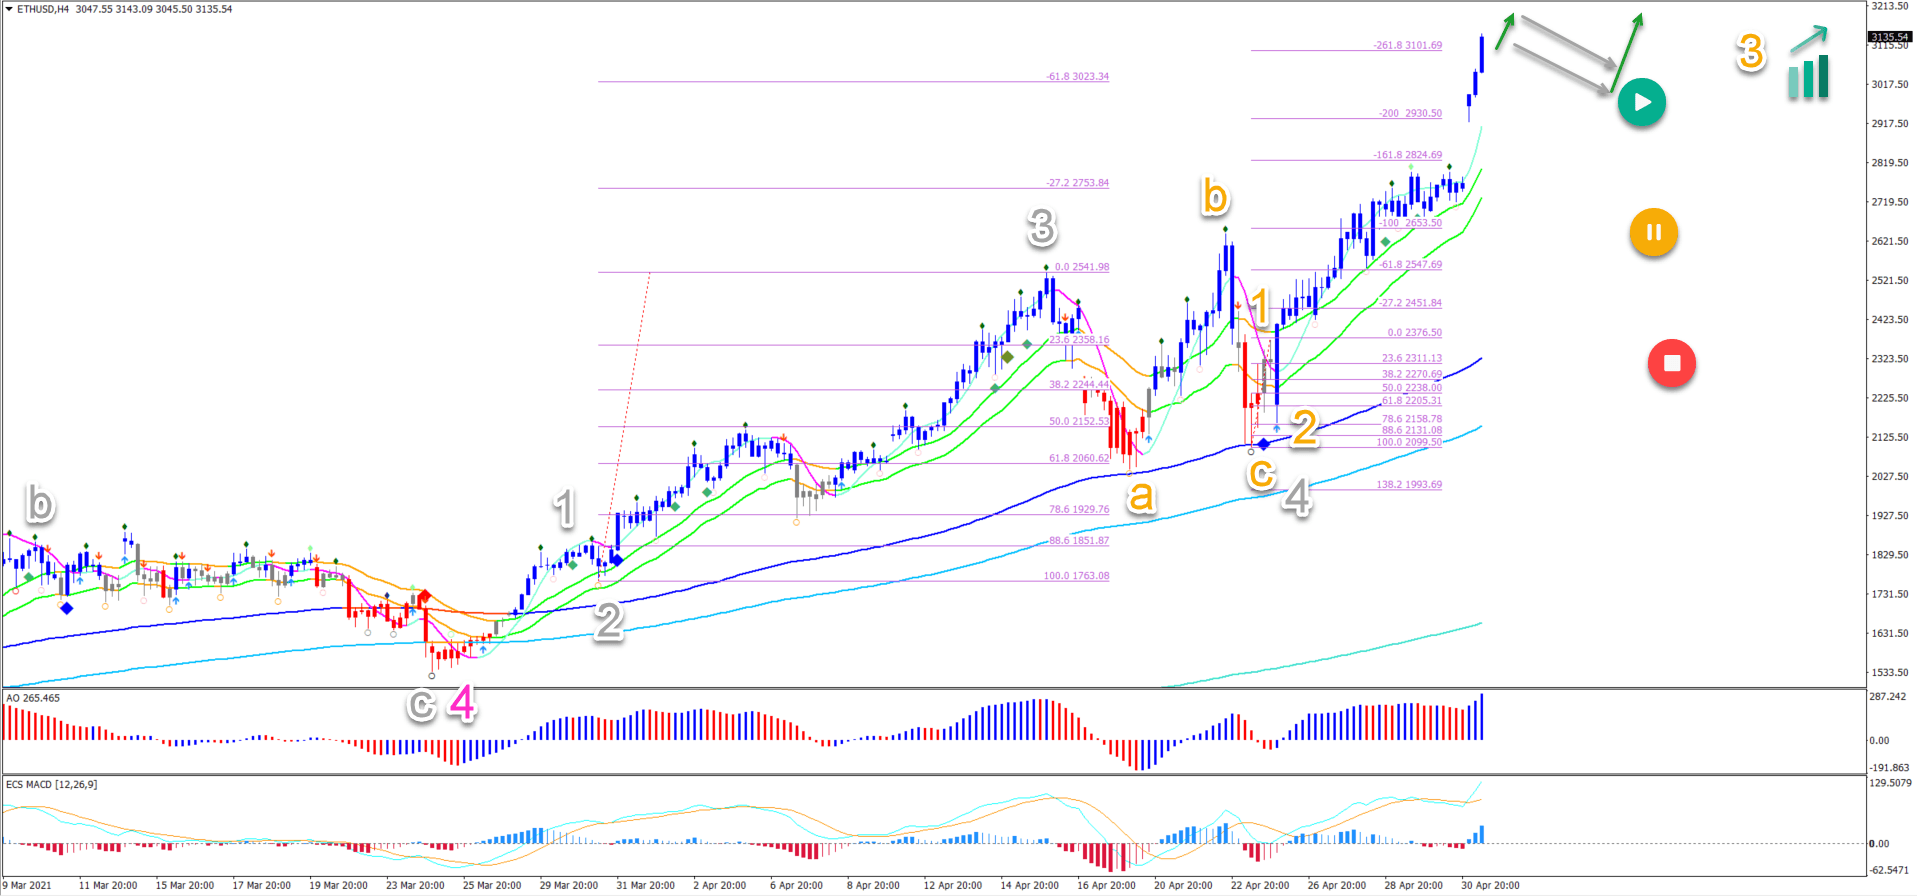
On the 4 hour chart, price action made a wave 1-2 (orange) pullback indeed after completing an ABC (orange) pattern in wave 4 (grey).

As mentioned in our previous analysis, price action managed to complete its correction at the 21 emas and support trend line (green) for a continuation higher. Let’s now review the next steps.
Price charts and technical analysis
The ETH/USD gapped higher over the weekend. The price action reached is now passing the -61.8% Fibonacci target (orange) after bouncing at the 38.2% Fibonacci level:
-
The current push up is confirming a strong rally - see the bars and lines on the AO and ecs.MACD (pink box) - within waves 3 (purple/red).
-
Also the moving averages (MAs) are confirming a full uptrend. The MAs are aligned, show a strong bullish angle, and the distance between them is increasing.
-
We can evaluate today’s daily candlestick when the candle closes.
-
A strong candle close indicates that the bulls are fully in control and a push higher is likely (green arrow)
-
A weaker candle close indicates that a pullback or a pauze could take place first. But the uptrend is so strong that a continuation higher is expected (blue arrow).
-
-
The next Fibonacci target is located at the -100% Fib level near $3,500.
On the 4 hour chart, price action made a wave 1-2 (orange) pullback indeed after completing an ABC (orange) pattern in wave 4 (grey):
-
The current bullish move up is typical for a wave 3 (orange).
-
Price action has already passed the -261.8% Fibonacci target for instance.
-
And also, the angle of the price swing is very steep.
-
-
A pullback does not have to be a wave 4 (orange) of this degree. It could easily be a pullback on a lower degree before the wave 3 (orange) is ready.
- Eventually, price action will complete a wave 3 (orange) and a pullback to and bounce at the 21 emas and Fibonacci levels around $2900, $3000, and $3250 (in case price reaches $3500) is likely.
The analysis has been done with the ecs.SWAT method and ebook.
Author

Chris Svorcik
FS method
Chris Svorcik is a trader, analyst, and educator with over 15 years of experience in financial markets, specializing in moving averages, market structure, and price patterns.


