Ethena Price Forecast: ENA nears breakout as bullish momentum builds, token unlock looms
- Ethena prepares for a range breakout to extend gains as bullish momentum resurfaces.
- More than 171 million ENA will be unlocked on Friday, equal to 2.69% of the circulating supply.
- A 5% surge in ENA Open Interest reflects increased traders’ confidence.

Ethena (ENA) edges higher by 1% at press time on Wednesday, extending the weekly gains to 9% so far. The technical and derivative outlook suggests a bullish bias, while the upcoming 171 million ENA unlock bears a potential supply dump risk.
Ethena token unlock poses a risk
The short-term recovery in Ethena this week remains intact after the 40.63 million ENA unlocked on Tuesday, which accounted for 0.64% of the circulating supply. This suggests the improvement in investors' confidence, preventing a quick supply dump.
However, the upcoming token unlock of 171.88 million ENA worth $119.54 million on Friday, which accounts for 2.69% of circulation, could increase the overhead supply. The core contributors of Ethena will receive 93.75 million tokens, while the remaining tokens will be distributed to investors.
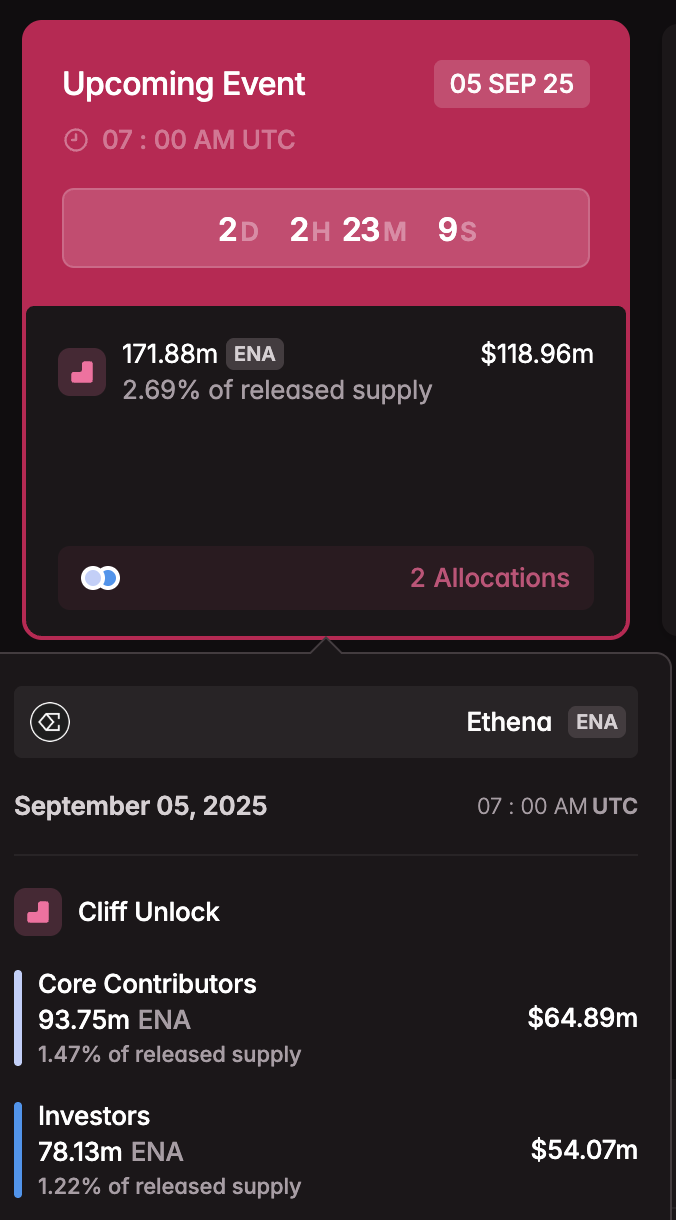
ENA token unlock. Source: Tokenomist
Ethena nears consolidation range breakout as bullish momentum resurfaces
Ethena marks the third consecutive day of uptrend, inching closer to a consolidation range breakout on the 4-hour chart. A clean push above the $0.6911 resistance level, which acts as the upper ceiling of the consolidation range, would extend ENAs’ recovery run. This potential breakout rally could target the $0.7533 level, reached on August 23.
Adding to the breakout anticipation, CoinGlass data indicates a 5% rise in ENA Open Interest (OI) to $1.34 billion, from $1.27 billion on Tuesday. This significant capital inflow of $60 million suggests increased interest from traders entering the ENA derivatives market.
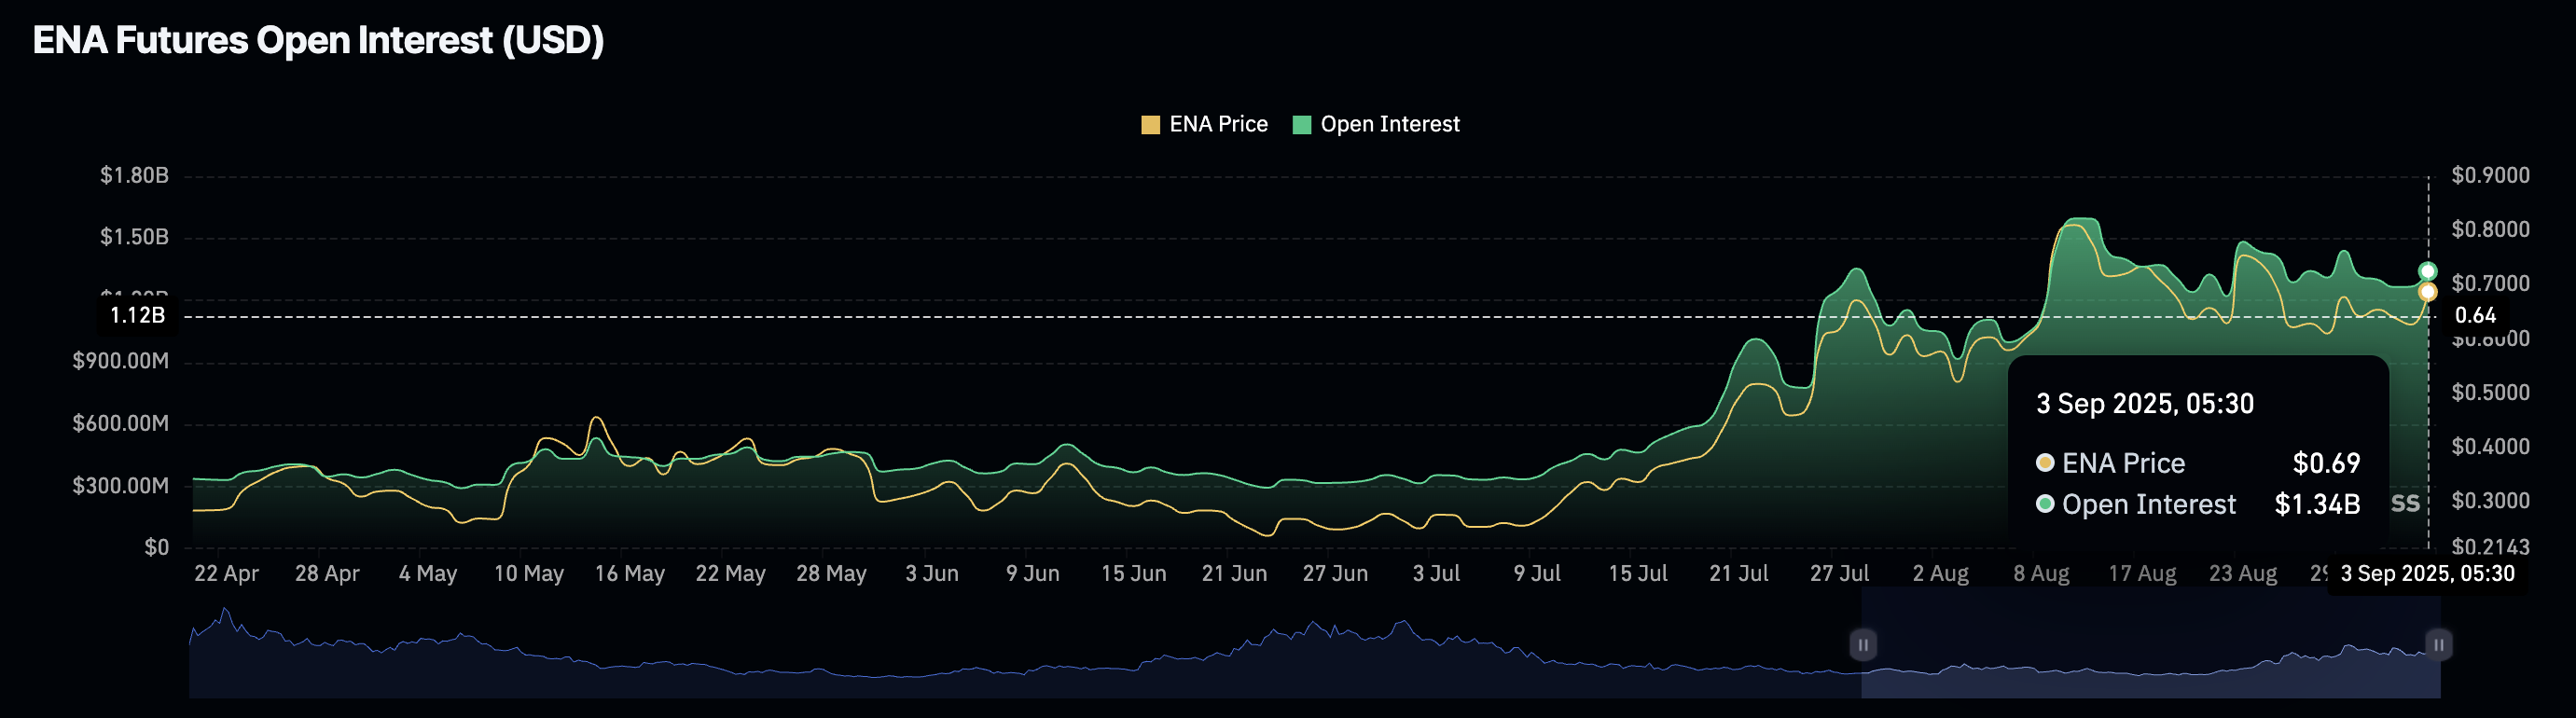
ENA Open Interest. Source: Coinglass
The recovery run witnesses a shift in trend momentum as the Relative Strength Index (RSI) heads higher to 62, signaling increasing buying pressure as room for growth lingers.
Additionally, the Moving Average Convergence Divergence (MACD) and its signal line preserve an uptrend motion as green histogram bars rise from the zero line. This indicates steady bullish momentum, which increases the chances of the range breakout.
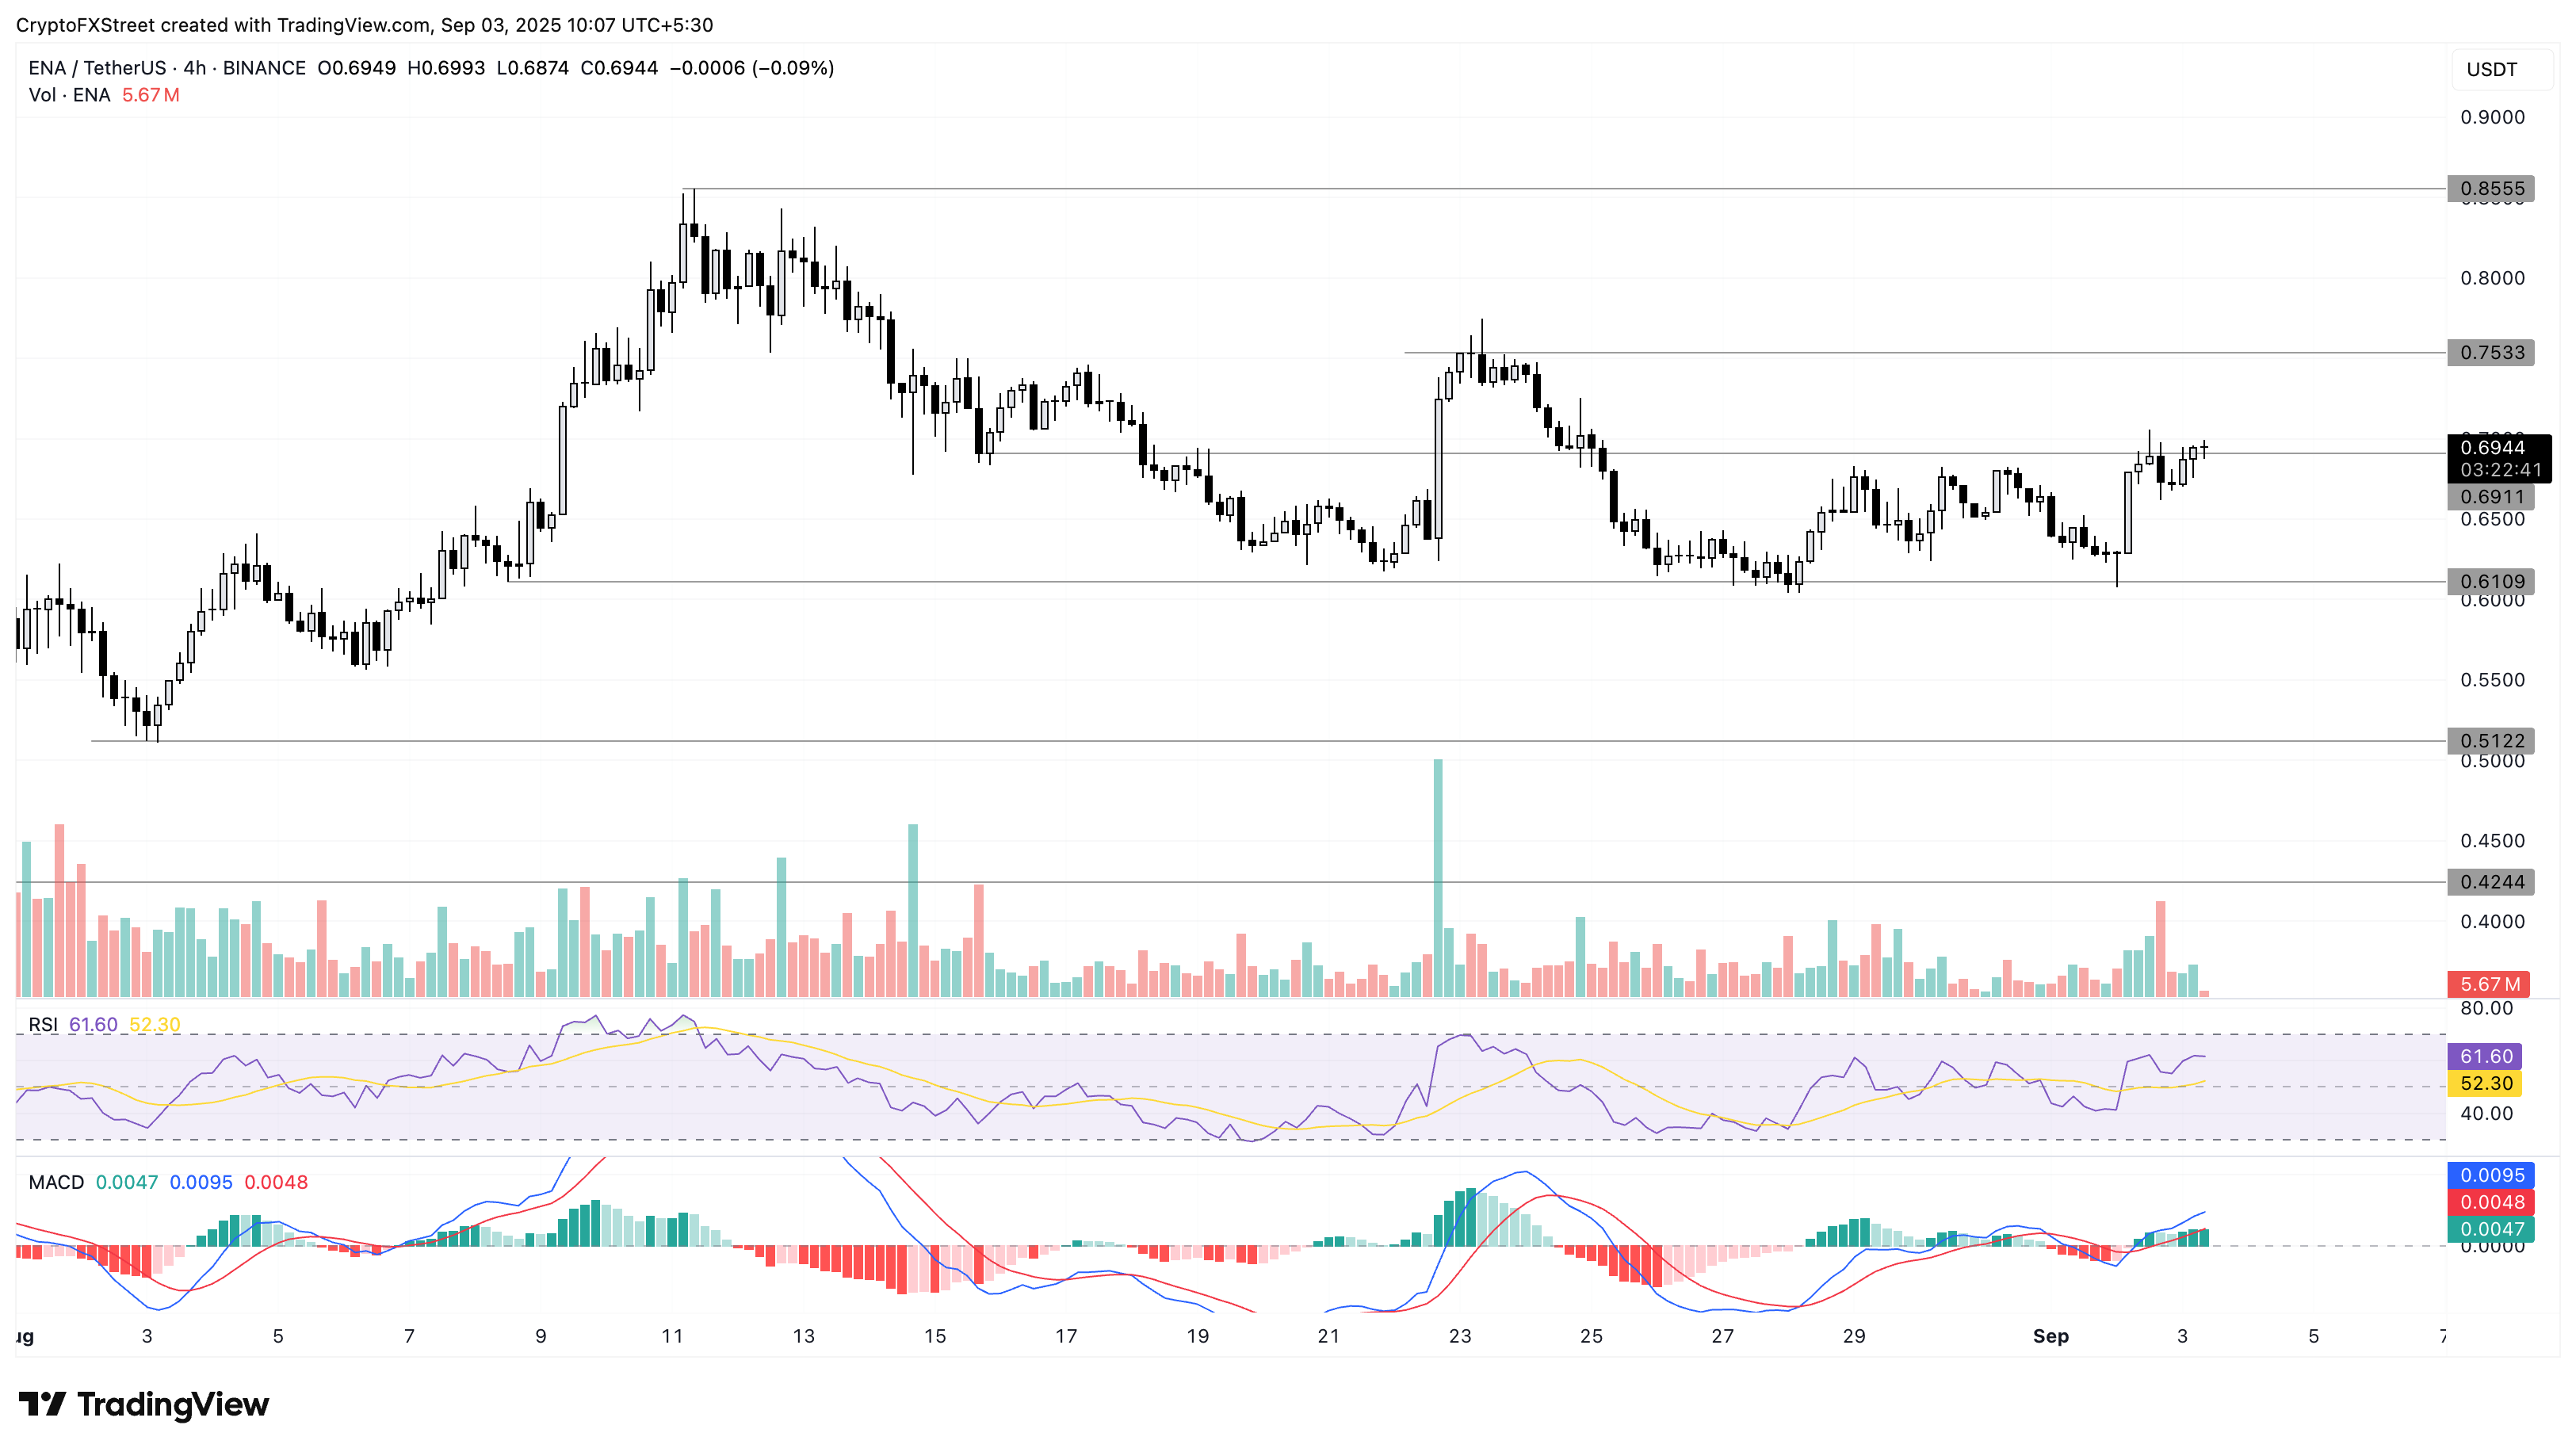
ENA/USDT daily price chart.
On the contrary, if ENA drops to the lower band at $0.6109, a decisive close below the support level could ignite a freefall in ENA to the $0.5122 mark, last tested on August 3.
Author

Vishal Dixit
FXStreet
Vishal Dixit holds a B.Sc. in Chemistry from Wilson College but found his true calling in the world of crypto.



