EOS technical analysis: EOS/USD continues its horizontal, sluggish movement
- EOS/USD is currently trading for $3.31 in the early hours of Thursday.
- Moving average convergence/divergence (MACD) indicator shows that the bulls have slightly edged out the bears.

EOS/USD daily chart
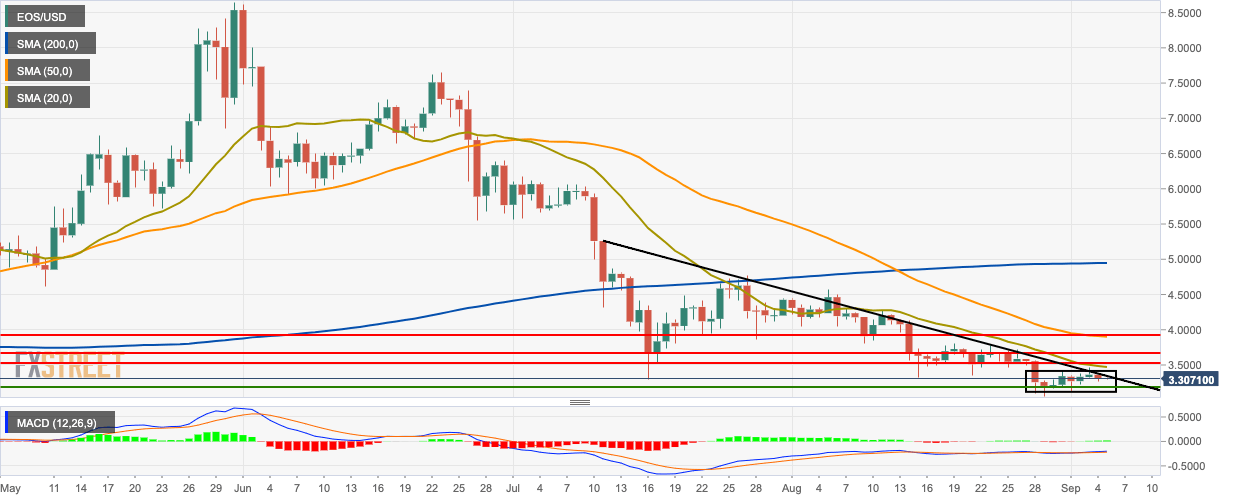
EOS/USD is trending horizontally in a sluggish manner and trying to break above the downward trending line. The price chart is also trending below the 200-day simple moving average (SMA 200), SMA 50 and SMA 20 curves. The moving average convergence/divergence (MACD) indicator shows that the bulls have slightly edged out the bears.
EOS/USD 4-hour chart
-637032548884204788.png)
The 4-hour chart is trending below the green Ichimoku cloud, SMA 200, and the SMA 20 curve. The SMA 20 has crossed over the SMA 50 curve, which is a bullish sign. The Elliott oscillator has had seven straight bearish sessions.
EOS/USD hourly chart
-637032548554506803.png)
The hourly EOS/USD chart has found resistance on the SMA 200 curve and is currently trending on the lower half of the 20-day Bollinger band. We can also see that EOS had gone up from $3.30 to $3.35 yesterday, where it experienced resistance at the SMA 50 curve and then dropped down. The relative strength index (RSI) indicator is trending around the neutral zone.
Key Levels
Author

Rajarshi Mitra
Independent Analyst
Rajarshi entered the blockchain space in 2016. He is a blockchain researcher who has worked for Blockgeeks and has done research work for several ICOs. He gets regularly invited to give talks on the blockchain technology and cryptocurrencies.


