EOS price analysis: EOS/USD climbs steadily out of the oversold zone
- EOS/USD has gone up from $3.27 to $3.33 this Monday.
- The Elliott oscillator shows two straight bullish sessions.

EOS/USD had a bullish Monday wherein the price went up from $3.27 to $3.33. The price has gone up further to $3.34 this Tuesday. The hourly chart shows that price faced resistance around $3.27 and fell to $3.23. The price then buoyed up to $3.35, where it met resistance and fell slightly to $3.33. This Tuesday, the price went up to $3.35, where it met resistance and fell to $3.34.
EOS/USD daily chart
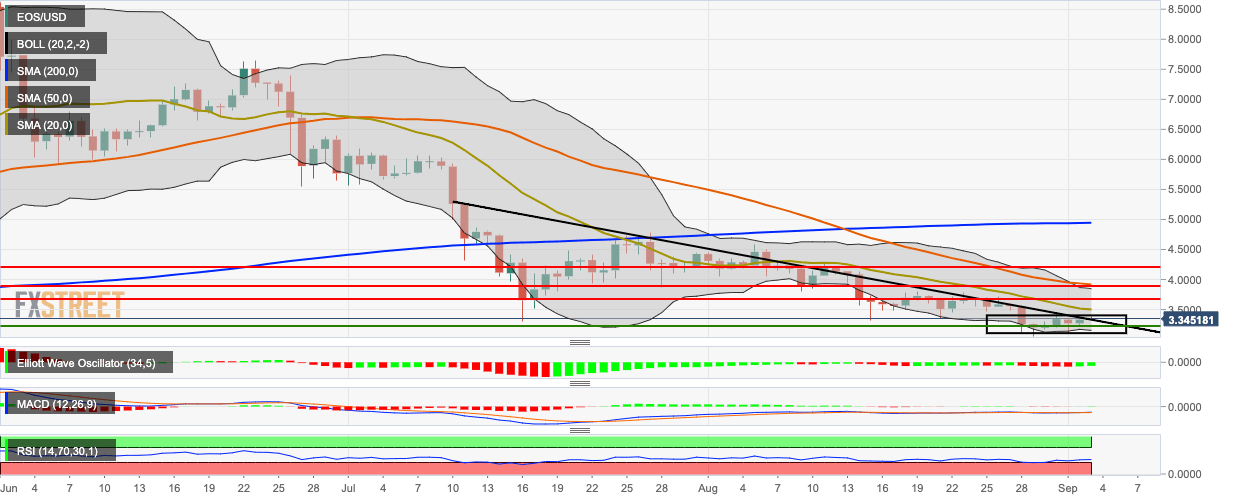
The EOS/USD price is currently trying to negotiate with the resistance offered by the downward trending line. The 200-day simple moving average (SMA 200), SMA 50 and SMA 20 curves. The 20-day Bollinger jaw has constricted showing decreasing market volatility. The Elliott oscillator shows two straight bullish sessions, while the relative strength index (RSI) has gone up steadily from the oversold zone. The moving average convergence/divergence (MACD) line is creeping along with the signal line, indicating that the momentum is not purely bullish or bearish.
Author

Rajarshi Mitra
Independent Analyst
Rajarshi entered the blockchain space in 2016. He is a blockchain researcher who has worked for Blockgeeks and has done research work for several ICOs. He gets regularly invited to give talks on the blockchain technology and cryptocurrencies.


