Elrond's Maiar exchange release could drive EGLD price to new all-time highs
- The snapshot interface of the Maiar exchange is now live.
- Elrond holders will have access to the MEX token by staking EGLD.
- EGLD price could be on the verge of a massive rebound, according to technicals.

Elrond has finally released the first snapshot of the Maiar Exchange, which will allow EGLD holders to see their MEX governance token balances increase. The MEX governance token will enable the community to make decisions with most of the token supply airdropped to EGLD holders.
Elrond releases the first batch of MEX tokens
The Maiar exchange was developed by the Elrond team and has been created to enable traders access to a better user interface, a powerful automated market maker, and better scaling with almost no fees.
The Maiar Exchange snapshot interface is live.$MEX balances increase after each weekly snapshot cycle. The first cycle is in progress.
— Beniamin Mincu ⚡ (@beniaminmincu) April 21, 2021
First $MEX balance calculations will be displayed after the first weekly snapshot cycle is complete.$EGLD x $MEX https://t.co/vicSHJi66O
MEX will be the first token of the Elrond ecosystem, and it is airdropped to EGLD holders. The exchange launch is targeted to go live on April 30.
"The Maiar exchange is tackling a hard trillion-dollar problem of global significance," the company wrote in a blog post. "Its ability to easily onboard hundreds of millions of users will rapidly grow it into one of the largest decentralized exchanges in the entire ecosystem."
Most EGLD holders are eligible to receive MEX tokens, which should increase the interest in the token and thus push up its price.
Elrond price aims for huge rebound if this level holds
On the 3-day chart, Elrond price has been trading above the 12 EMA since November 2020, which means this support moving average is critical. In the last week, EGLD managed to close above this key level again.
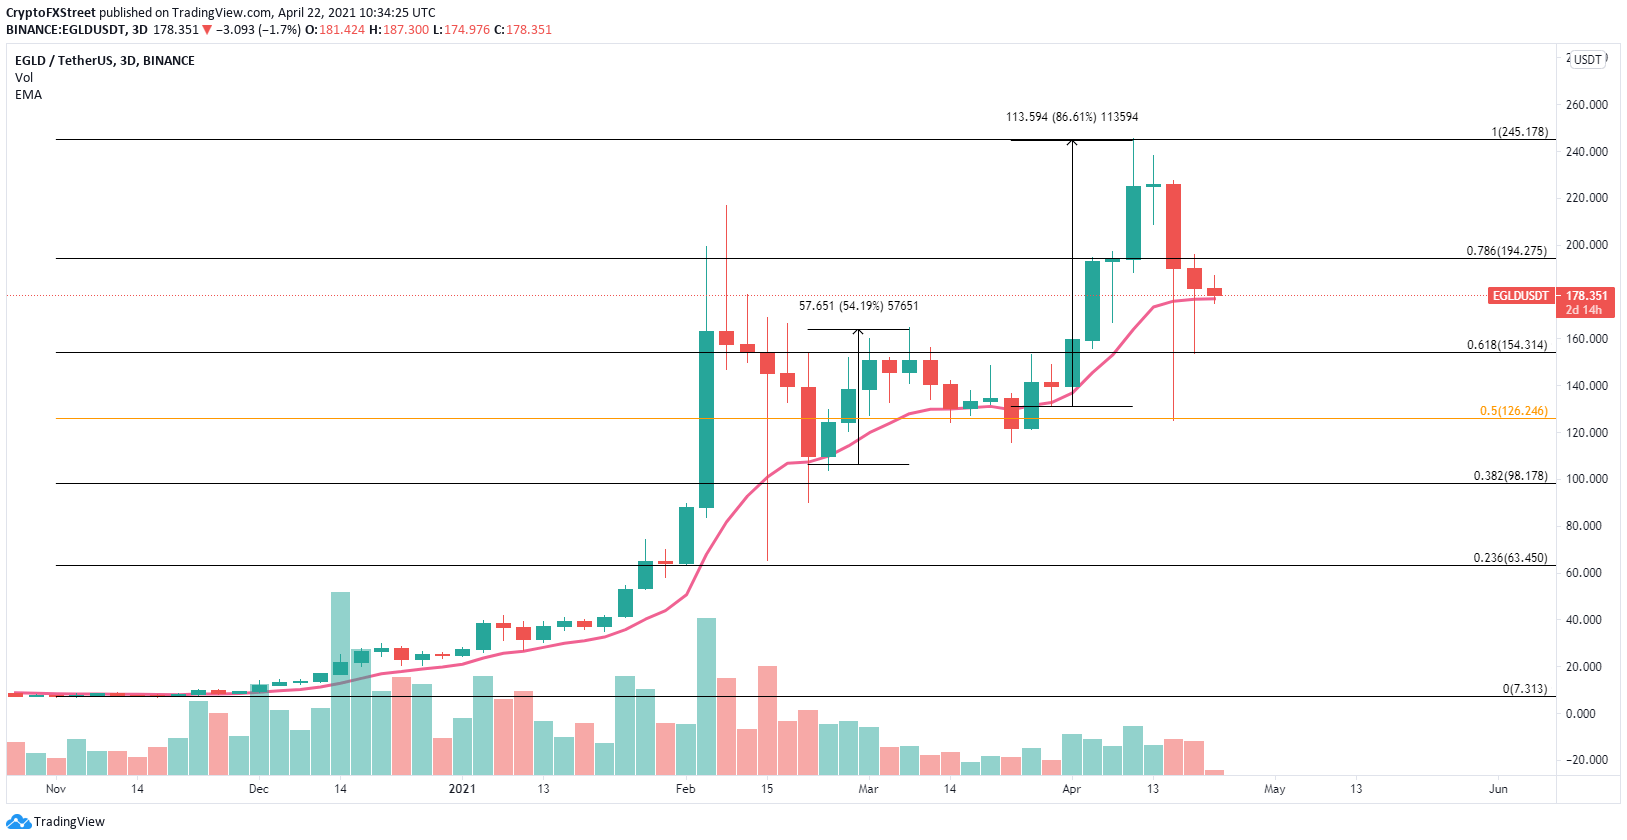
EGLD/USD 3-day chart
In the last few months, most rebounds from this critical moving average have resulted in massive upswings. A breakout above the 78.6% Fibonacci retracement level at $194 could quickly drive EGLD to the previous all-time high of $245.
Additionally, on the 12-hour chart Elrond has formed an ascending broadening wedge pattern. In the past several months, whenever the Relative Strength Index (RSI) dropped to 40 or below, the digital asset had massive rebounds.
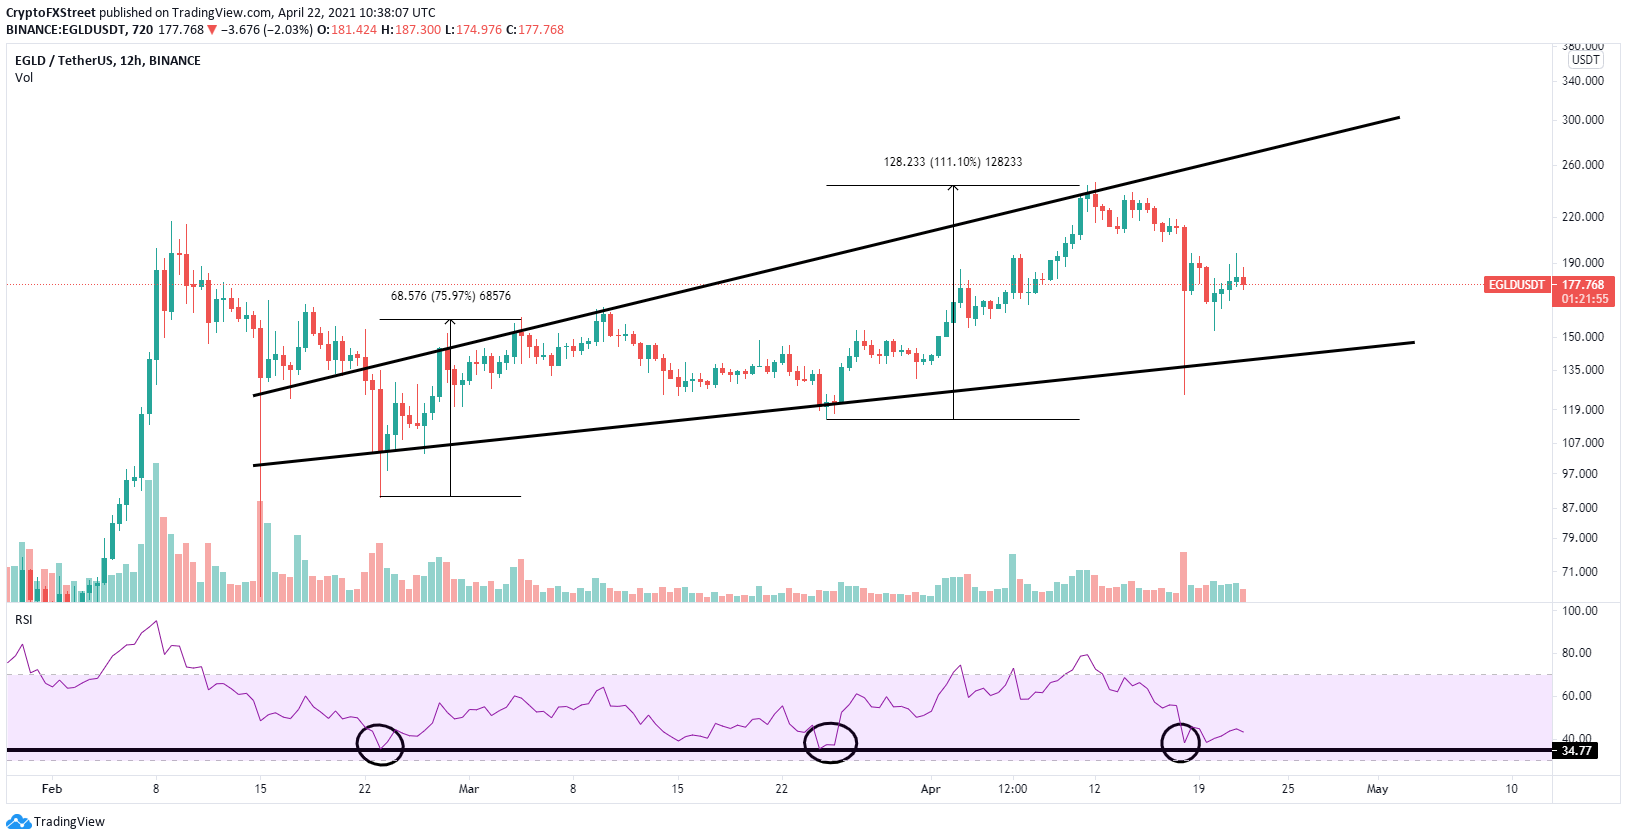
EGLD/USD 12-hour chart
Once again, the RSI crossed below 40, which indicates that EGLD is ready for a rebound. This could quickly take the digital asset up to the top trend line of the pattern at $300.
Author

Lorenzo Stroe
Independent Analyst
Lorenzo is an experienced Technical Analyst and Content Writer who has been working in the cryptocurrency industry since 2012. He also has a passion for trading.



