|

Elliott Wave analysis: Ethereum likely extending in wave five [Video]

The short-term Elliott Wave analysis for Ethereum (ETHUSD) indicates that a bullish cycle, initiated from the April 9, 2025 low, is unfolding as a five-wave impulse structure. Starting from this low, wave (1) concluded at $1,687.20, followed by a corrective pullback in wave (2) that ended at $1,473. Ethereum then resumed its upward trajectory in wave (3), reaching $2,738.90, as illustrated in the one-hour chart below. The subsequent wave (4) correction formed a double-three Elliott Wave structure.

Ethereum 60-minute Elliott Wave technical chart

Chart

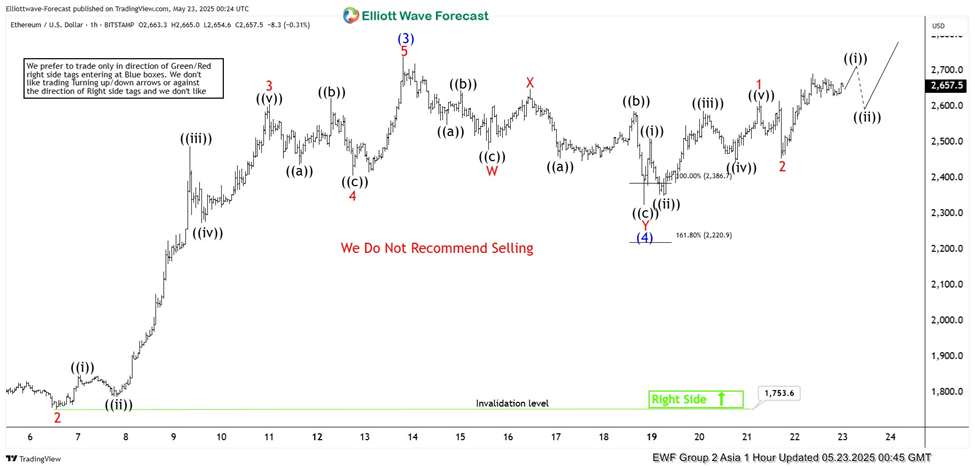
In this correction, wave W declined to $2,478.80, followed by a recovery in wave X to $2,649. The corrective wave Y then completed wave (4) at $2,405.20. From this point, Ethereum has entered wave (5), advancing with an internal five-wave subdivision. Within wave (5), wave 1 peaked at $2,615.40 as a diagonal, with wave 2 retracing to $2,454. As long as Ethereum remains above the wave (4) low of $2,405.20, the outlook favors further gains. Additionally, while the pivot low at $1,753.60 holds, any pullbacks are likely to attract buyers in a 3, 7, or 11-swing pattern, supporting Ethereum’s potential to extend higher in the near term.

ETH/USD Elliott Wave technical [Video]

Author

Elliott Wave Forecast Team

Elliott Wave Forecast Team

ElliottWave-Forecast.com

More from Elliott Wave Forecast Team
Share:

Editor's Picks

Bitcoin slips below $75,000 as selling pressure accelerates

Bitcoin (BTC) price falls below the $75,000 mark on Monday, having corrected nearly 11% in the previous week and reaching level not seen in nearly 10 months. Market momentum has clearly turned bearish, with technical indicators pointing to further downside toward the next key support at $70,000.

Top 3 Price Prediction: Bitcoin, Ethereum, and Ripple weakness persists after massive correction

Bitcoin, Ethereum and Ripple trade in red on Monday after dipping by over 11%, 19% and 13%, respectively, in the previous week. The top three cryptocurrencies have shed 10%, 17%, and 10.5% in the first month of 2026, highlighting persistent downside pressure.

Top Crypto Losers: Monero, Ethereum, and Kaspa face intense sell-off

Altcoins, including Monero, Ethereum, and Kaspa, are leading the broader cryptocurrency market decline with a steep correction on Sunday. Monero and Ethereum are close to critical support levels near $400 and $2,300, respectively.

Solana Price Forecast: SOL slips below $100, risks deeper correction

Solana (SOL) price extends its correction, trading below $100 on Monday after losing more than 15% in the previous week. The bearish price action is further backed by derivatives data, which shows rising short bets and negative funding rates.

Bitcoin Price Annual Forecast: BTC holds long-term bullish structure heading into 2026

Bitcoin (BTC) is wrapping up 2025 as one of its most eventful years, defined by unprecedented institutional participation, major regulatory developments, and extreme price volatility.

Bitcoin: BTC correction deepens as Fed stance, US-Iran risks, mining disruptions weigh

Bitcoin (BTC) price extends correction, trading below $82,000 after sliding more than 5% so far this week. The bearish price action in BTC was fueled by fading institutional demand, as evidenced by spot Exchange-Traded Funds (ETFs), which recorded $978 million in inflows through Thursday.