Dogecoin, Shiba Inu, Pepe Open Interest hits record high, bulls target double-digit rise
- Dogecoin edges higher by over 12%, extending the bullish run for the fourth consecutive day.
- Shiba Inu appreciates 8% to surpass the 200-day EMA, with bulls eyeing further gains.
- Pepe extends the triangle breakout rally by over 5% amid a Golden Cross.

Meme coins such as Dogecoin (DOGE), Shiba Inu (SHIB), and Pepe (PEPE) trade in the green on Friday, extending their weekly gains as the broader cryptocurrency market recovers with Bitcoin (BTC) holding above $120,000. The total market capitalization of meme coins reaches $85 billion amid improving market sentiment and an increase in altcoins’ market cap, signaling the next potential altcoin season on the horizon.
DOGE, SHIB, and PEPE dominate the top three ranking in the meme coin segment, with market capitalizations of $35.44 billion, $8.98 billion, and $5.85 billion, respectively. Based on the 2021 capital rotation cycle from Bitcoin to altcoins (altseason), the top three meme coins could outperform the broader market.
Dogecoin eyes further gains amid increased buying pressure
Dogecoin edges higher by over 12% at press time on Friday, extending the bullish run for the fourth consecutive day. The reversal in DOGE accounts for 44% recovery so far in July, surpassing the 200-day Exponential Moving Average (EMA) at $0.2033.
Dogecoin bulls target the $0.2597 level marked by the high of May 11. A successful bullish close above this level could extend the uptrend to $0.2867, the February 14 high.
The Moving Average Convergence/Divergence (MACD) indicator suggests increased momentum as green histogram bars surge above the zero line. A positive trend in the MACD and its signal line indicates a bullish trend in motion.
The Relative Strength Index (RSI) stands at 79, indicating overbought conditions as buying pressure intensifies. Dogecoin could extend the uptrend if RSI remains in the overbought zone.
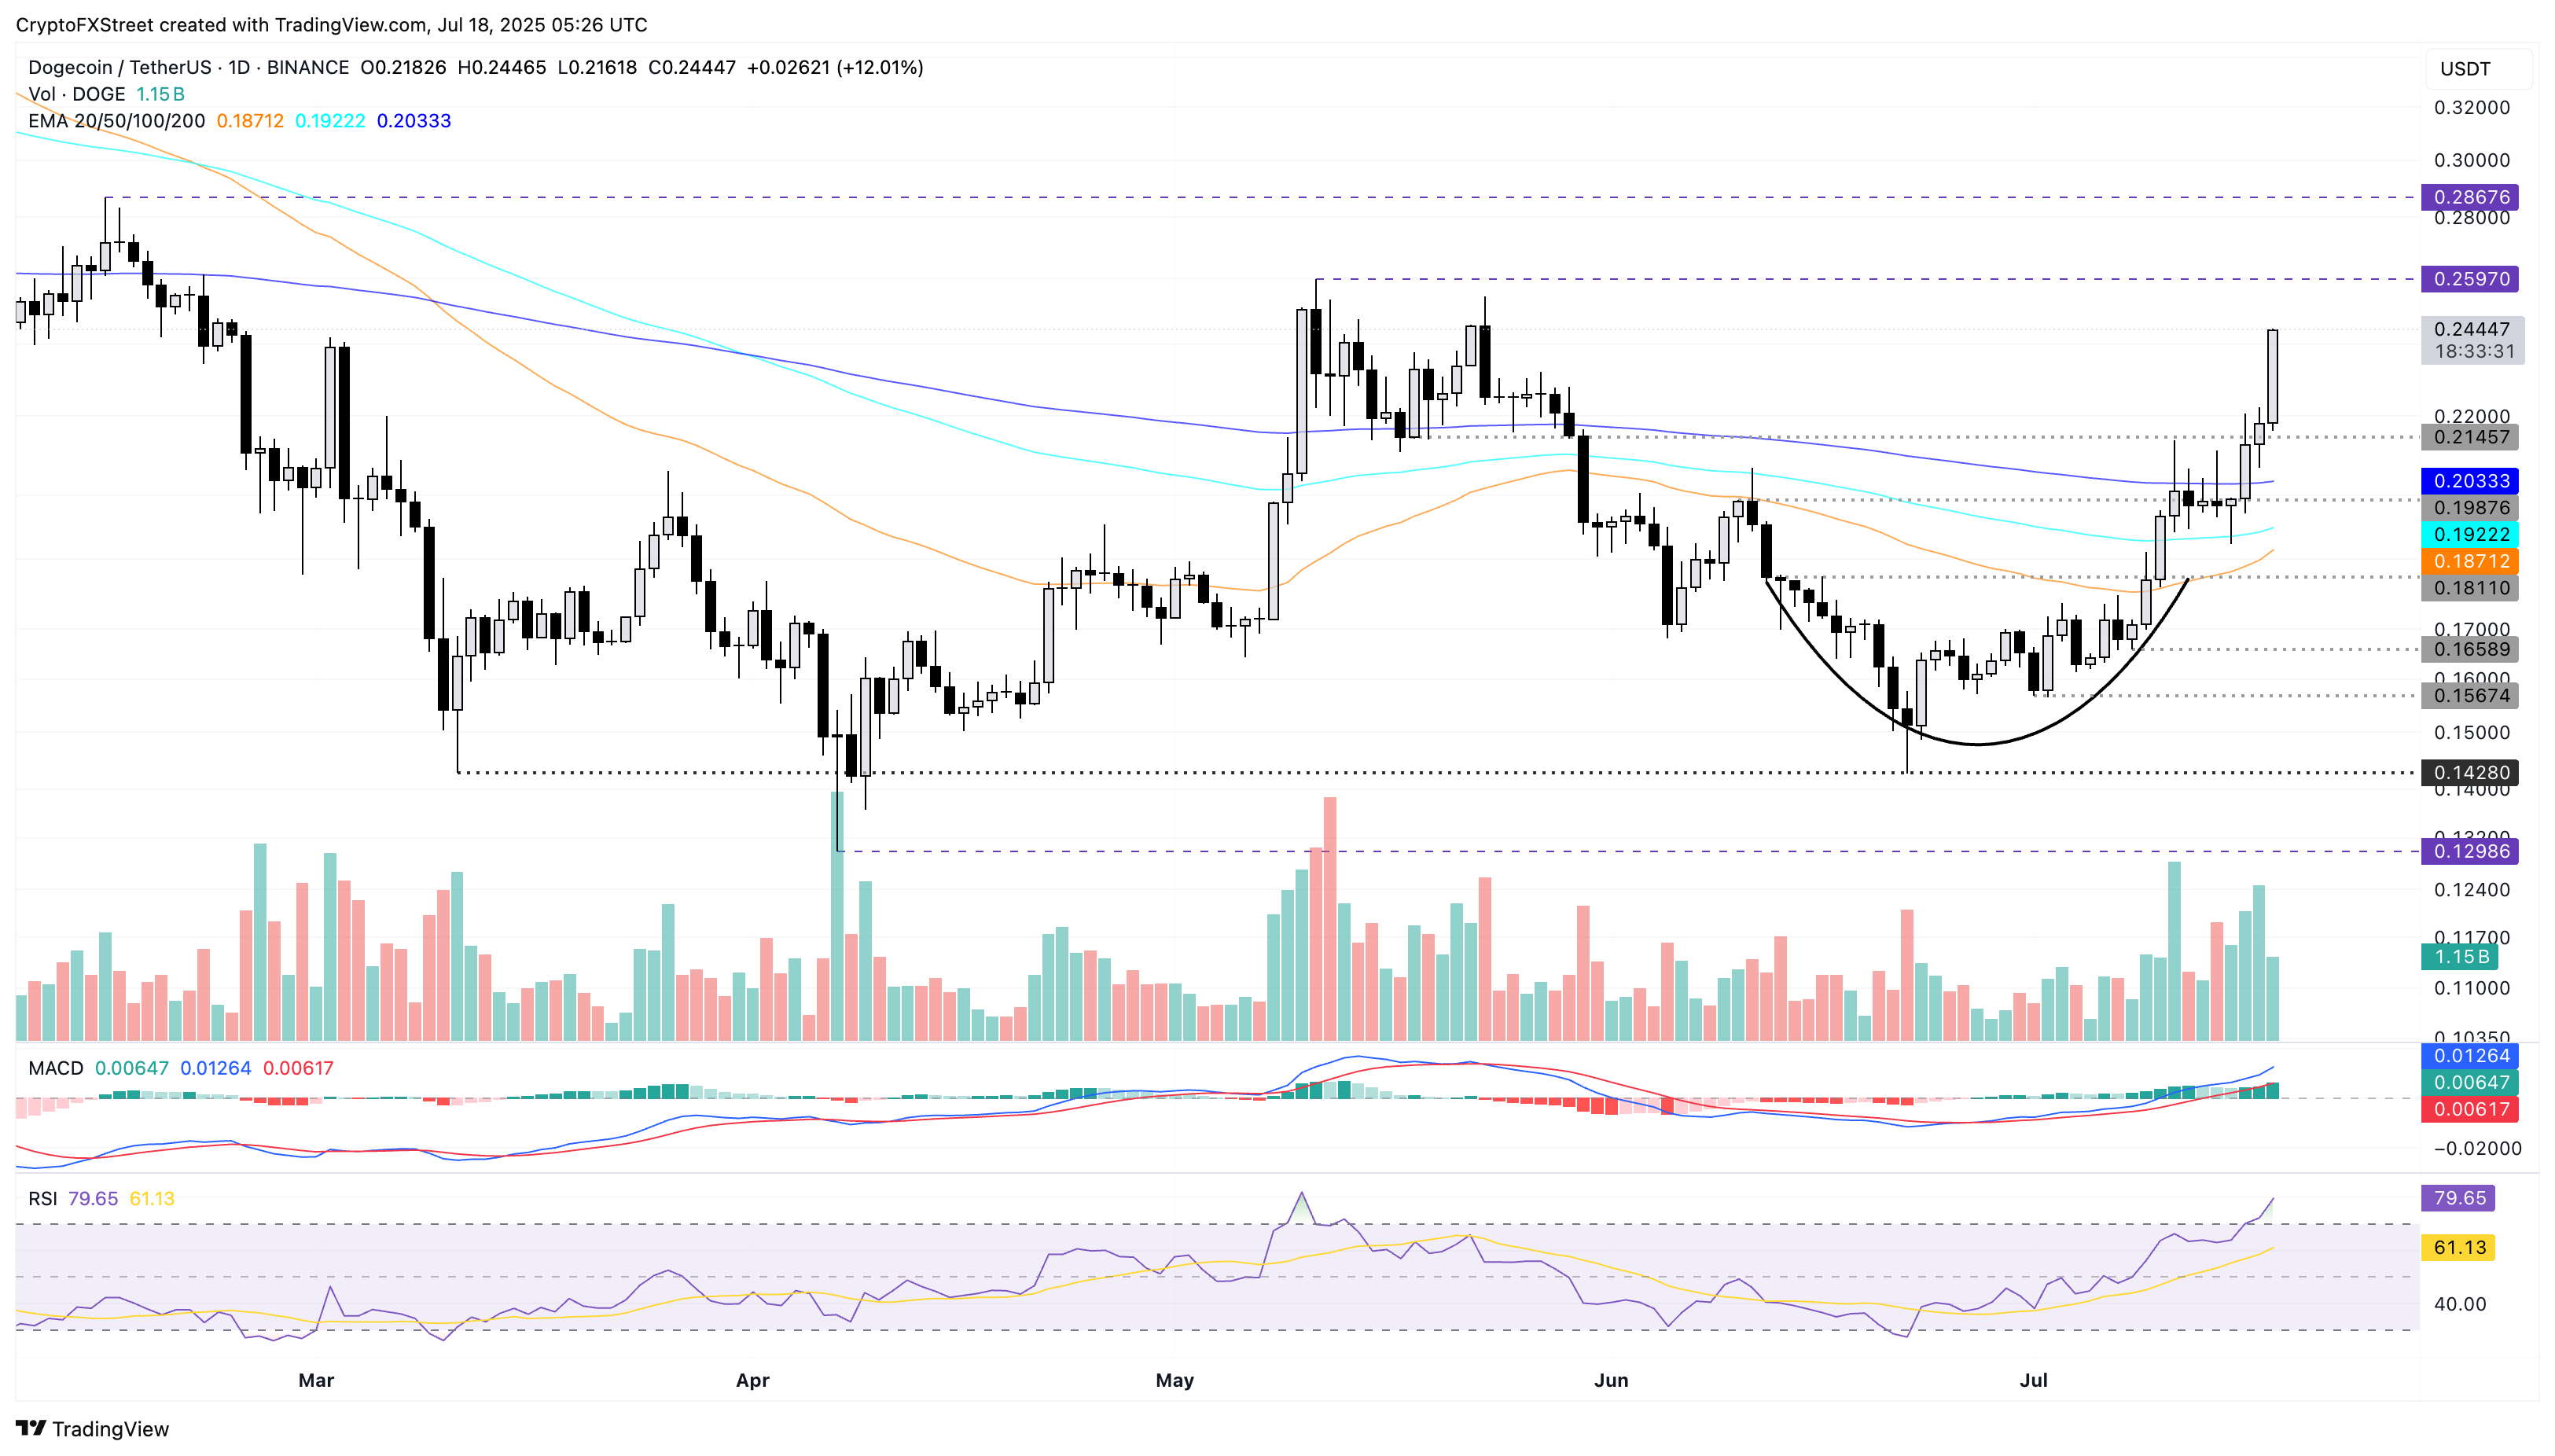
DOGE/USDT daily price chart.
Dogecoin’s recovery run fuels optimism in the derivatives market. CoinGlass data shows DOGE Open Interest (OI) jumps 27% in the last 24 hours to hit $3.92 billion, the highest OI since February 2. A spike in OI refers to increased interest from traders in the meme coin, resulting in heightened capital inflows.
The volume has surged over 39% in the last 24 hours, reaching $12.97 billion. Further, the massive wipeout of $31.49 million short positions compared to $6.04 million in long positions in the last 24 hours reflects a bullish field.
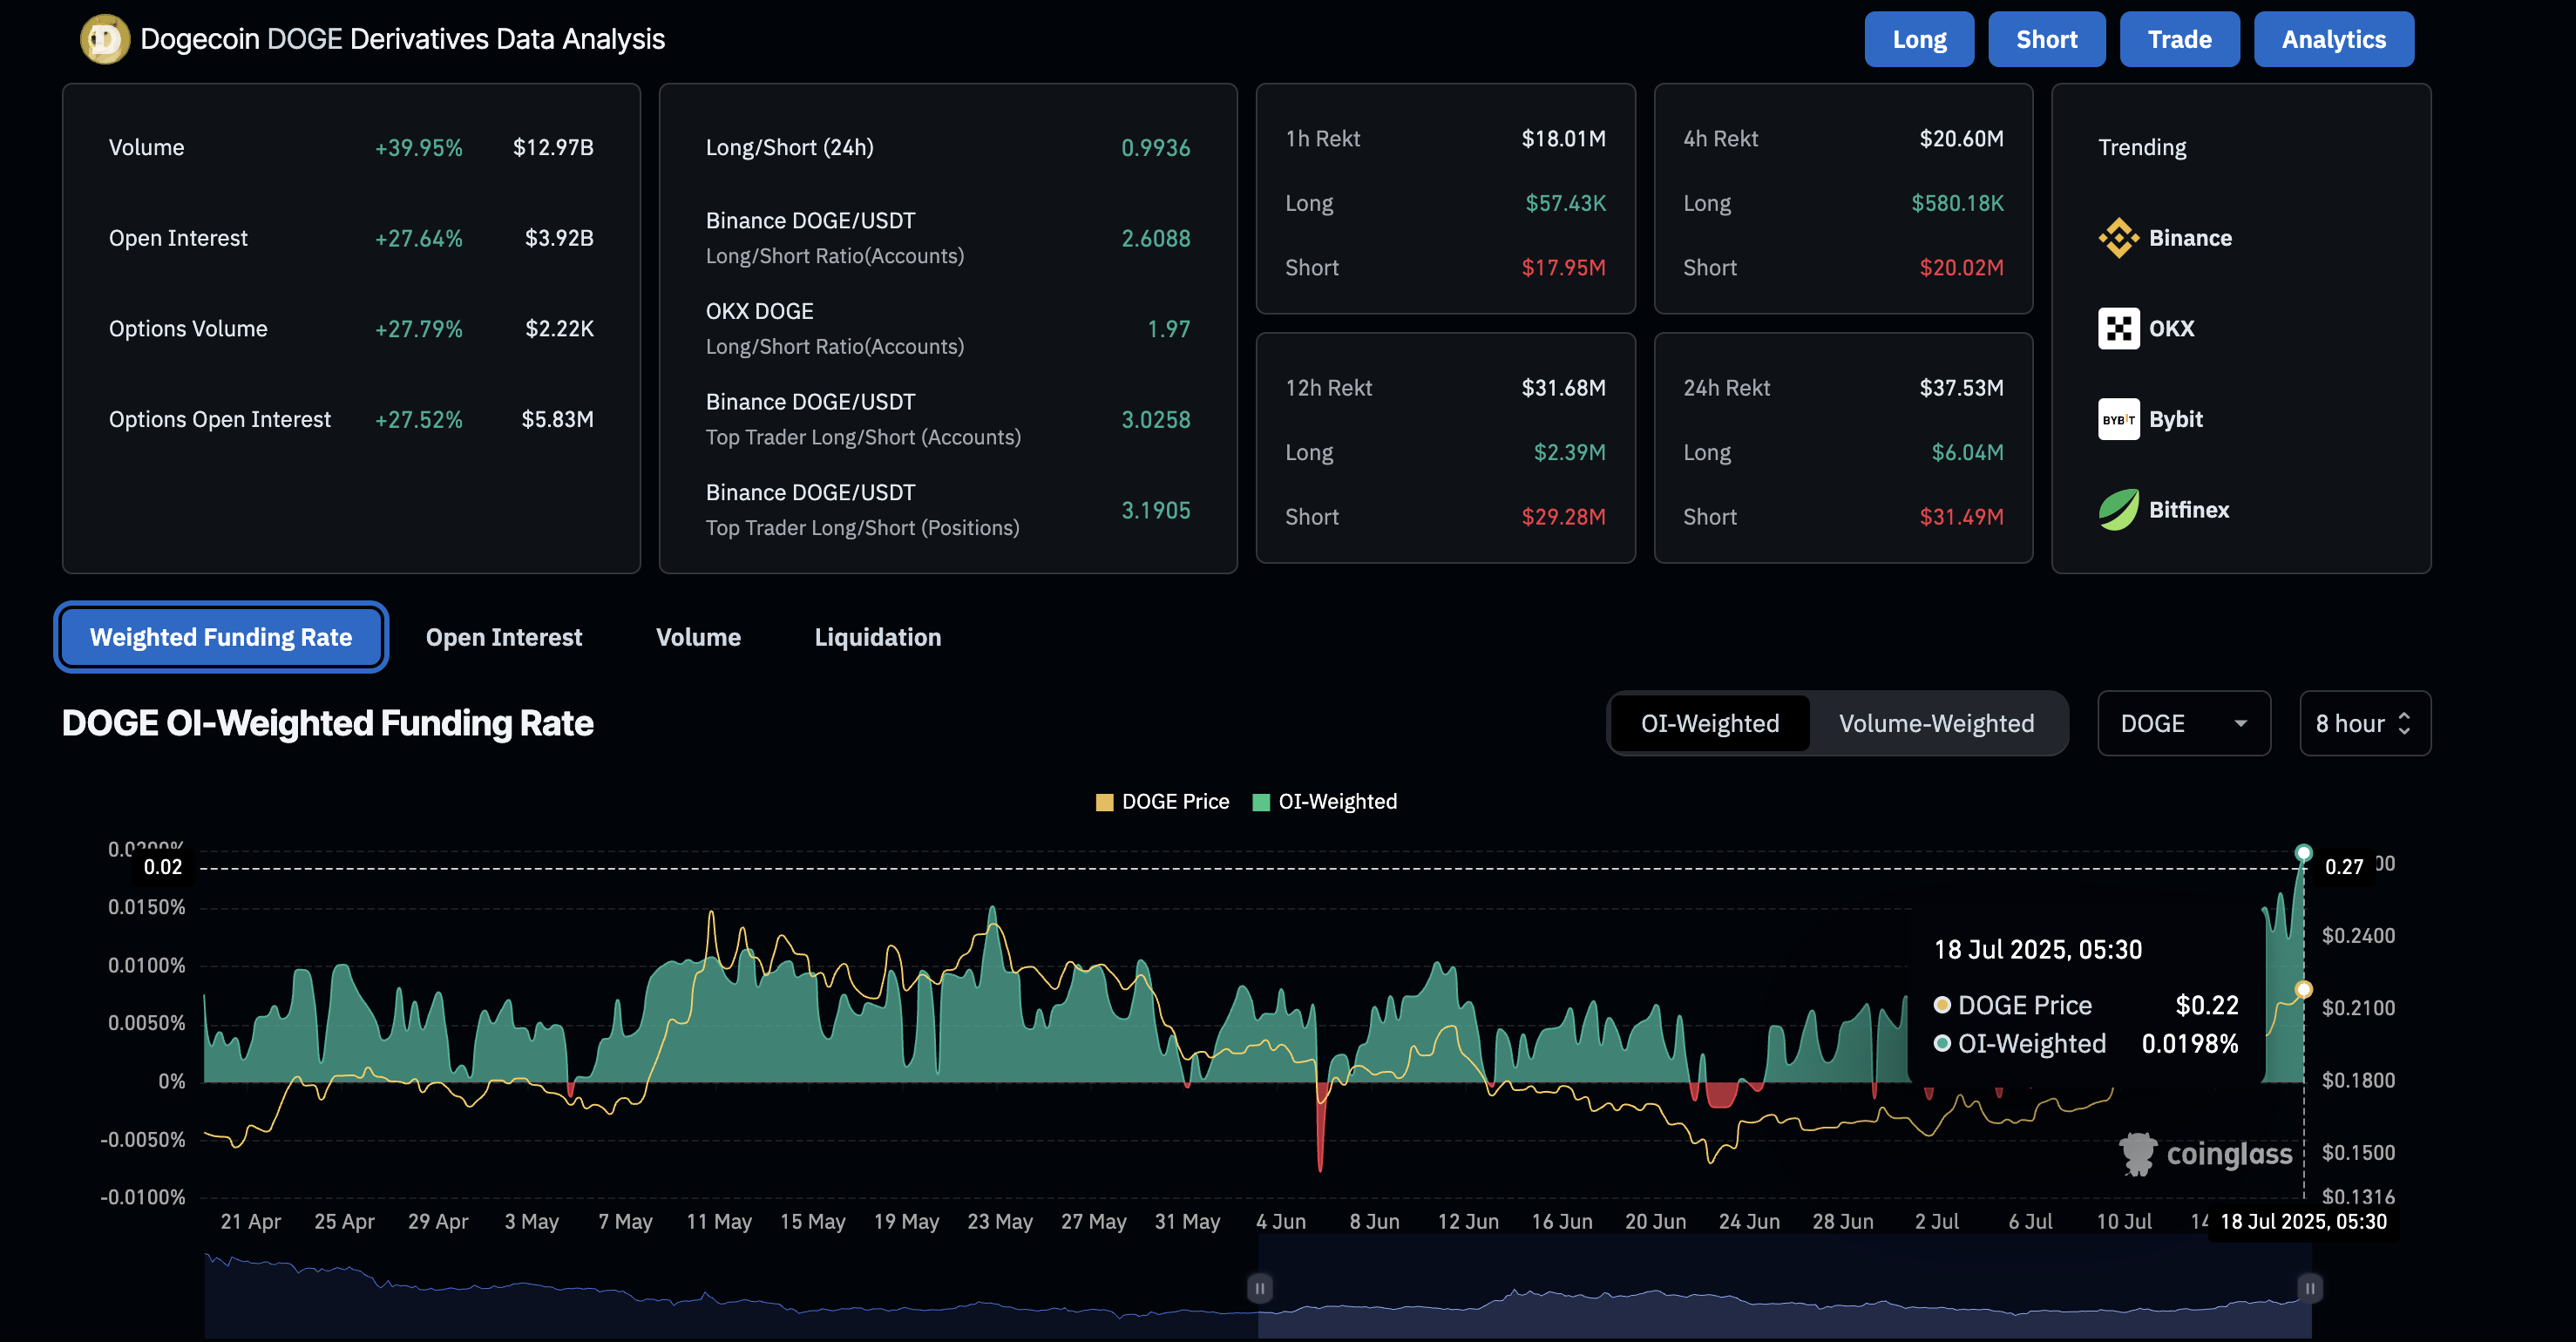
DOGE Open Interest. Source: Coinglass
However, if Dogecoin fails to maintain its momentum, it could retest the $0.2145 level, marked by the May 17 daily close.
Shiba Inu gains bullish momentum, eyes double-digit rise
Shiba Inu ticks higher by 8% so far on Friday as the meme coin segment gains traction. SHIB’s intraday gains cross above the 200-day EMA at $0.00001452, extending the gains by nearly 18% so far this week.
With the fourth consecutive bullish candle, SHIB nears the $0.00001565 resistance level, last tested on May 23. A daily close above this level could extend the bullish run to $0.00001734, last tested on May 12.
The technical indicators exhibit a bullish inclination, as the MACD and its signal line surge into positive territory, marked by rising green bars from the zero line. Furthermore, the RSI on the daily chart reads 78, indicating intense buying pressure.
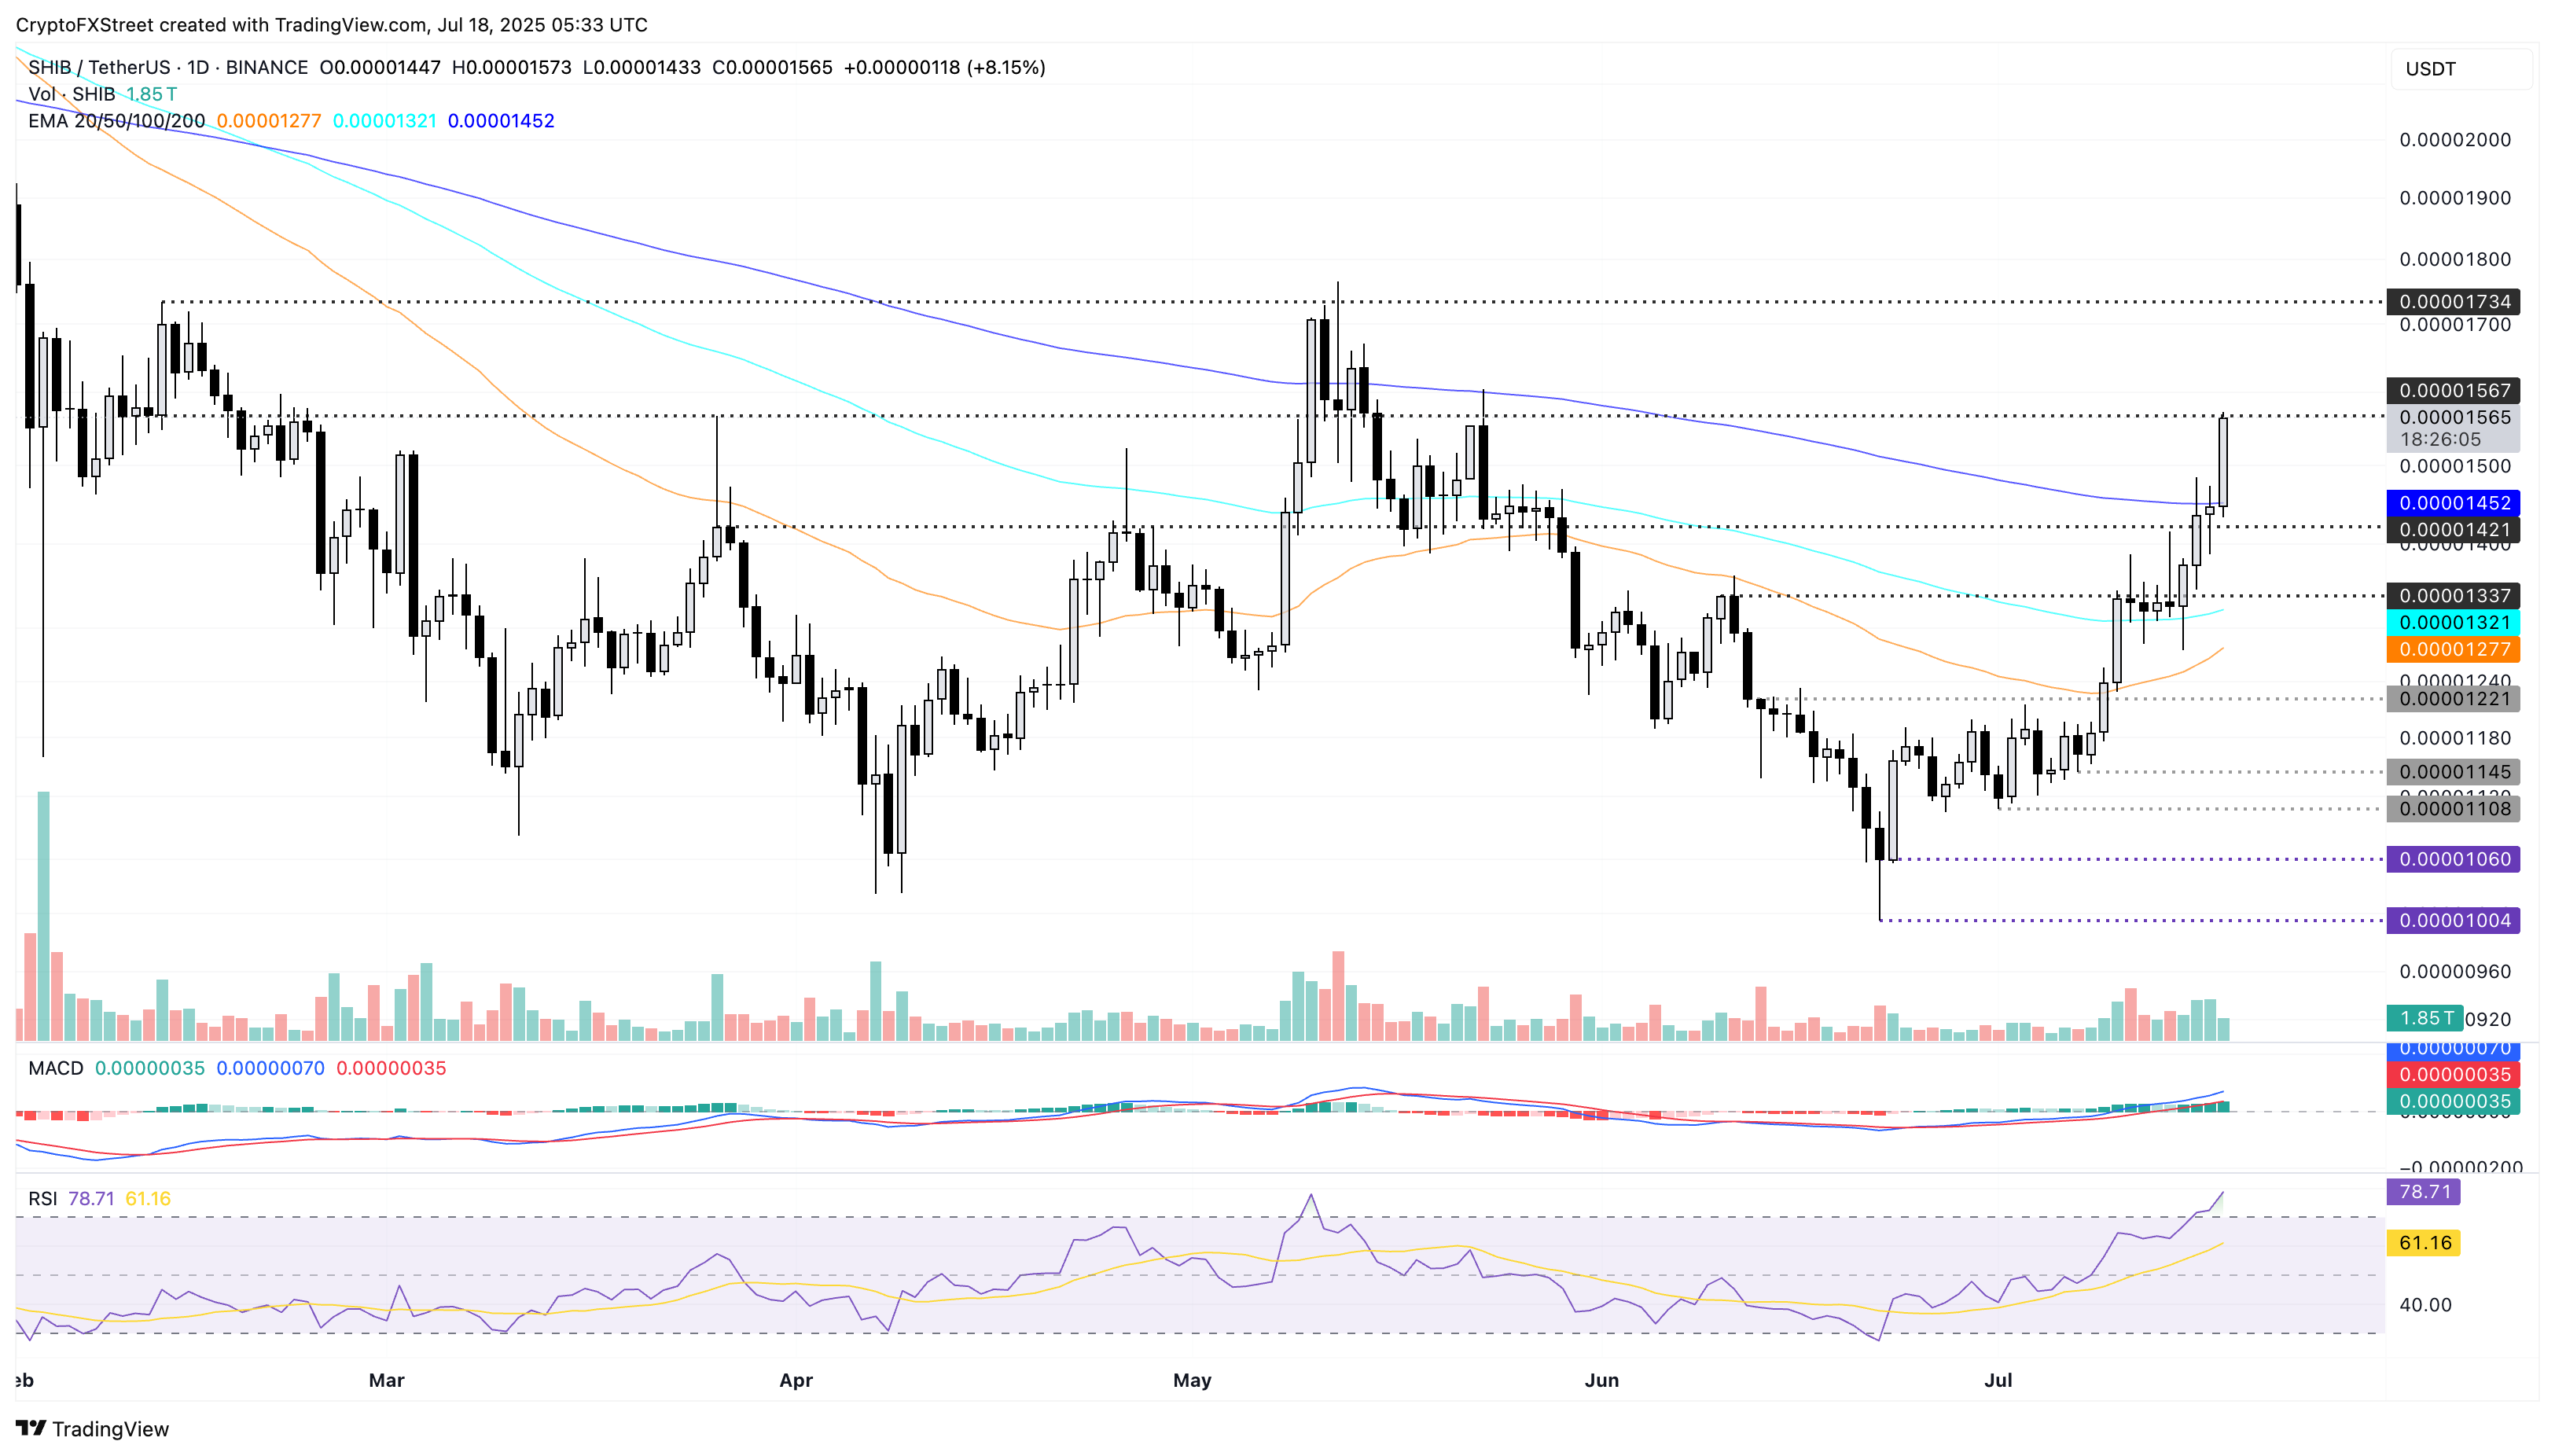
SHIB/USDT daily price chart.
CoinGlass data shows a near 20% surge in SHIB OI over the last 24 hours, reaching a six-month high of $295.47 million. Adding credence to increased buying, the OI-weighted funding rate is at 0.0155%, up from 0.0110% on Thursday.
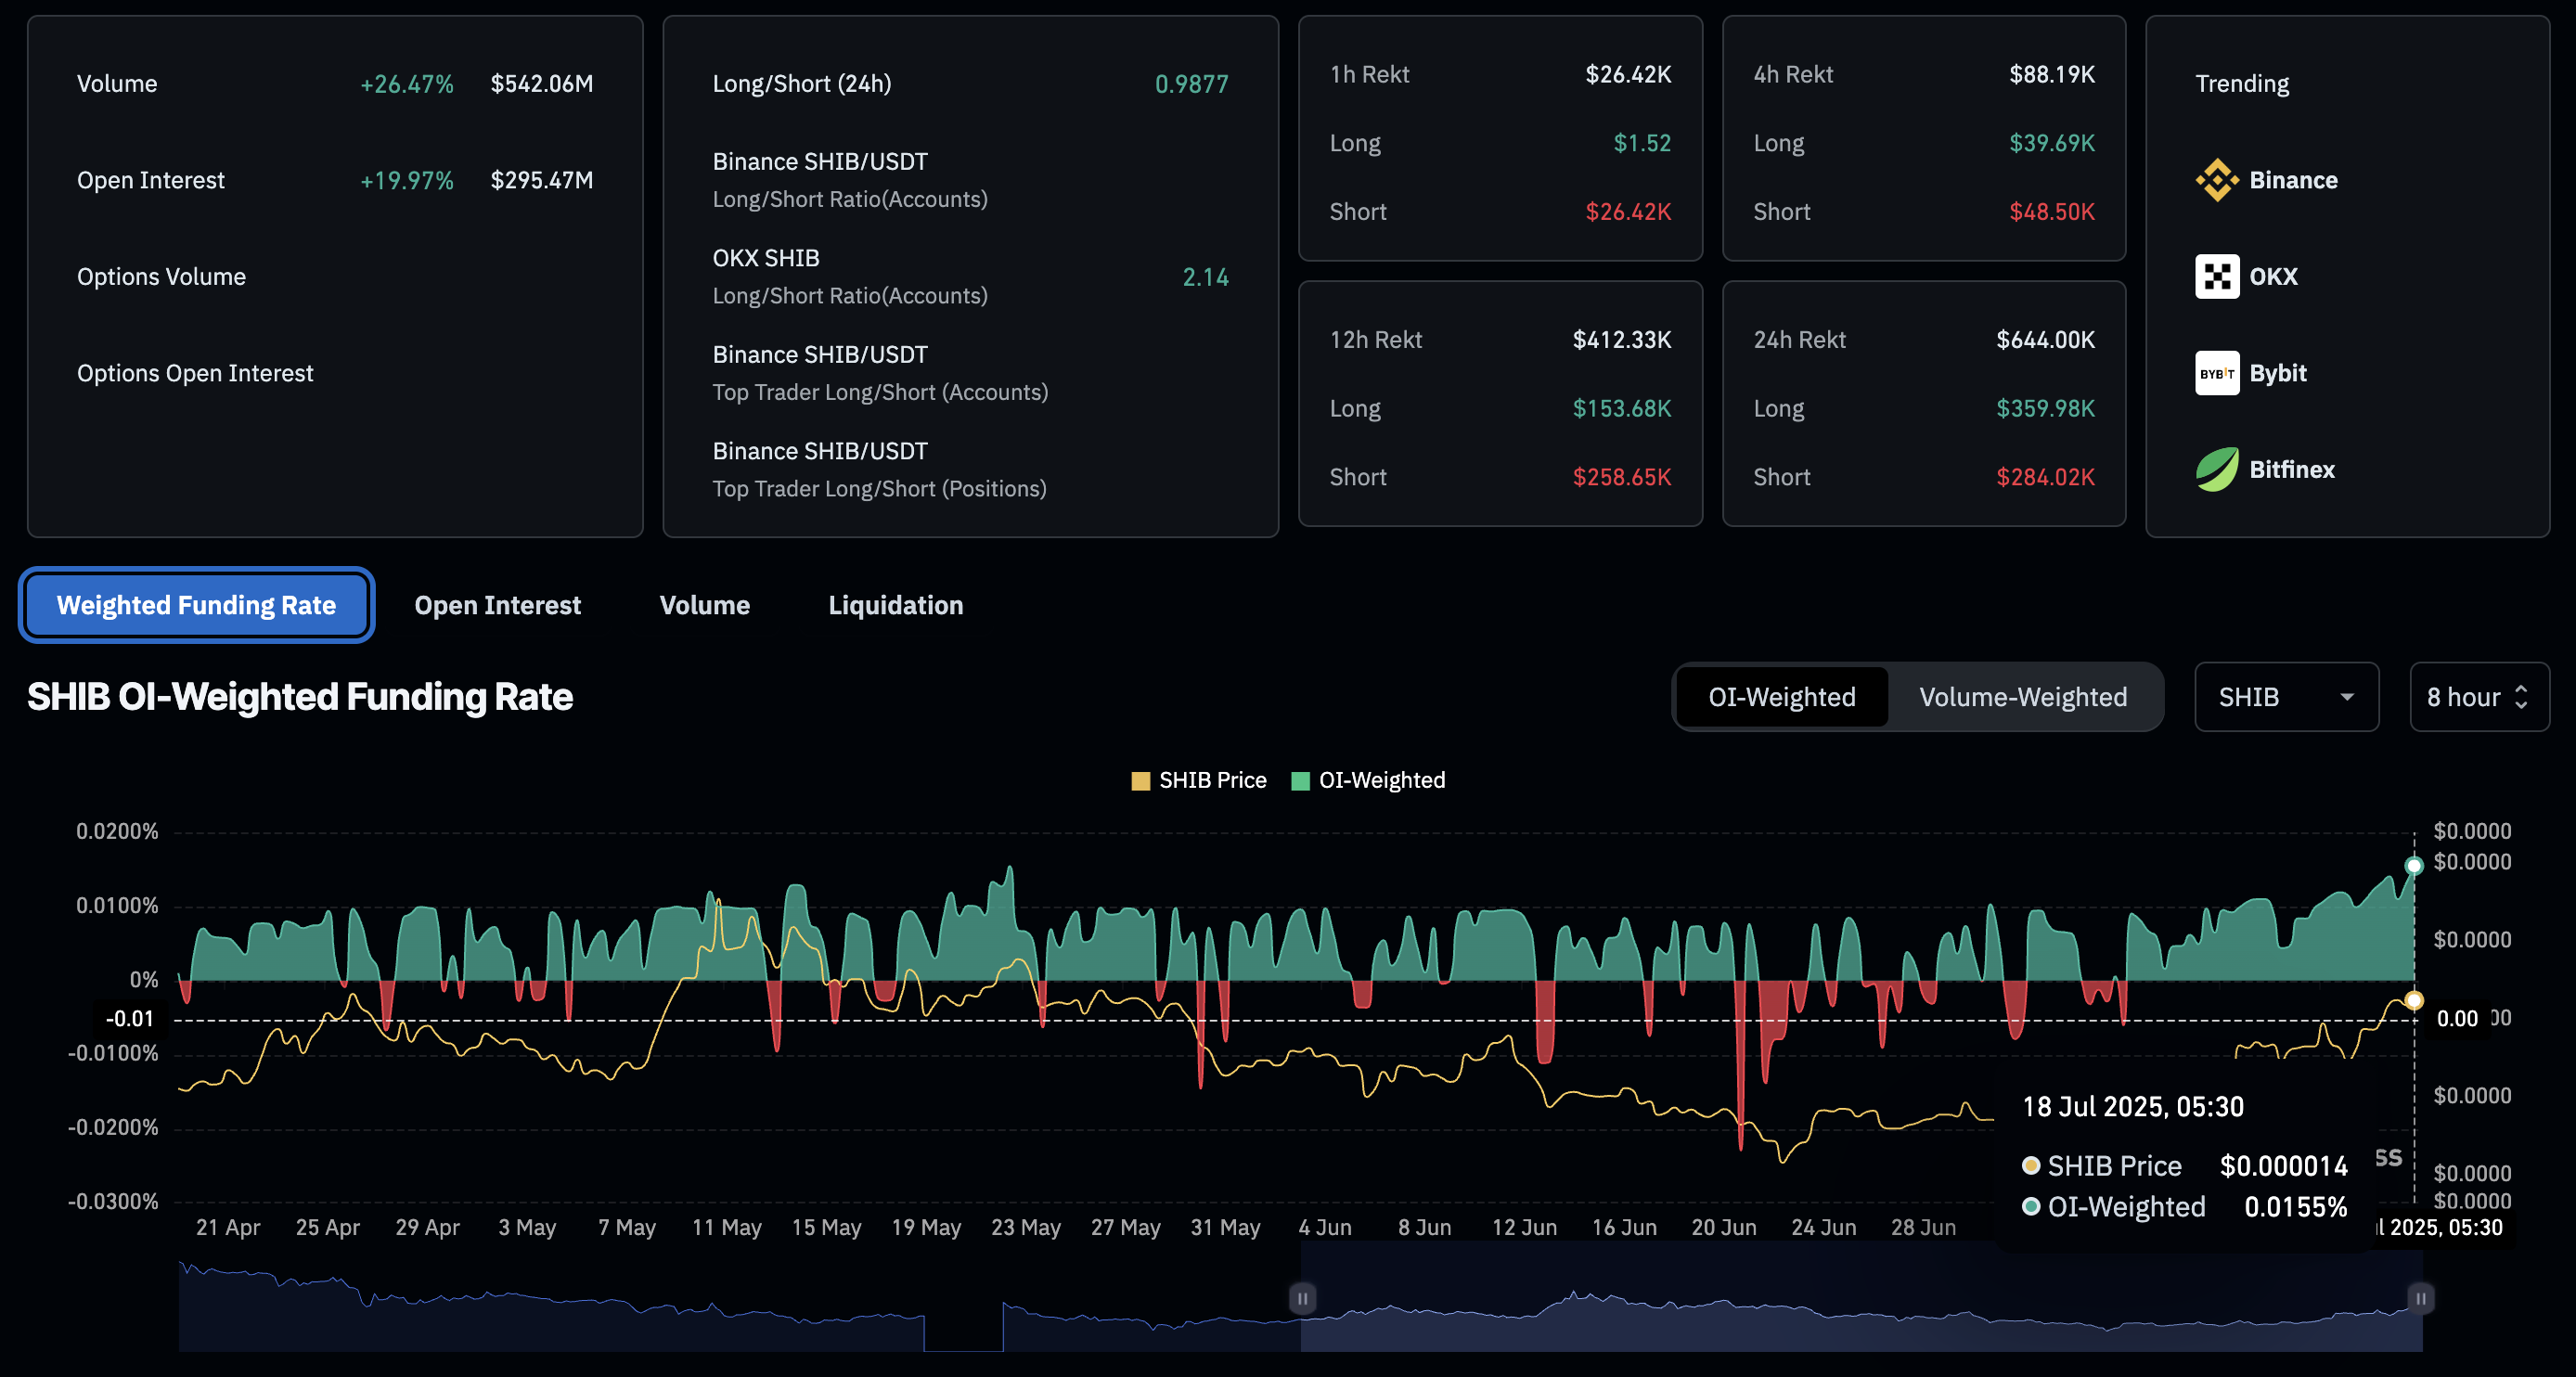
SHIB Open Interest. Source: Coinglass
On the flip side, a reversal in Shiba Inu could result in a retest of the 200-day EMA at $0.00001452.
PEPE gains bullish momentum amid record-high Open Interest levels
Pepe edges higher by over 5% at press time on Friday, undermining a 1.26% drop from Thursday to continue the prevailing uptrend. The meme coin trades at a monthly high with a 45% surge so far in July.
Pepe exceeds the $0.00001362 level marked by the June 10 high, extending the triangle breakout rally on the daily chart. A decisive close above this level, unlike the bullish failure on Wednesday, could extend the uptrend to the May 23 high of $0.00001632.
The 50-day and 200-day Exponential Moving Averages (EMAs) marked a Golden Cross on Wednesday, while the 100-day EMA inches closer to surpassing the 200-day EMA. Sidelined investors could consider the crosses as a buy signal, indicating that short-term and medium-term recoveries are outpacing the longer-term slowdown.
The MACD and its signal line are in an uptrend above the zero line, and the RSI is at 72, mimicking the same bullish signals from DOGE and SHIB.
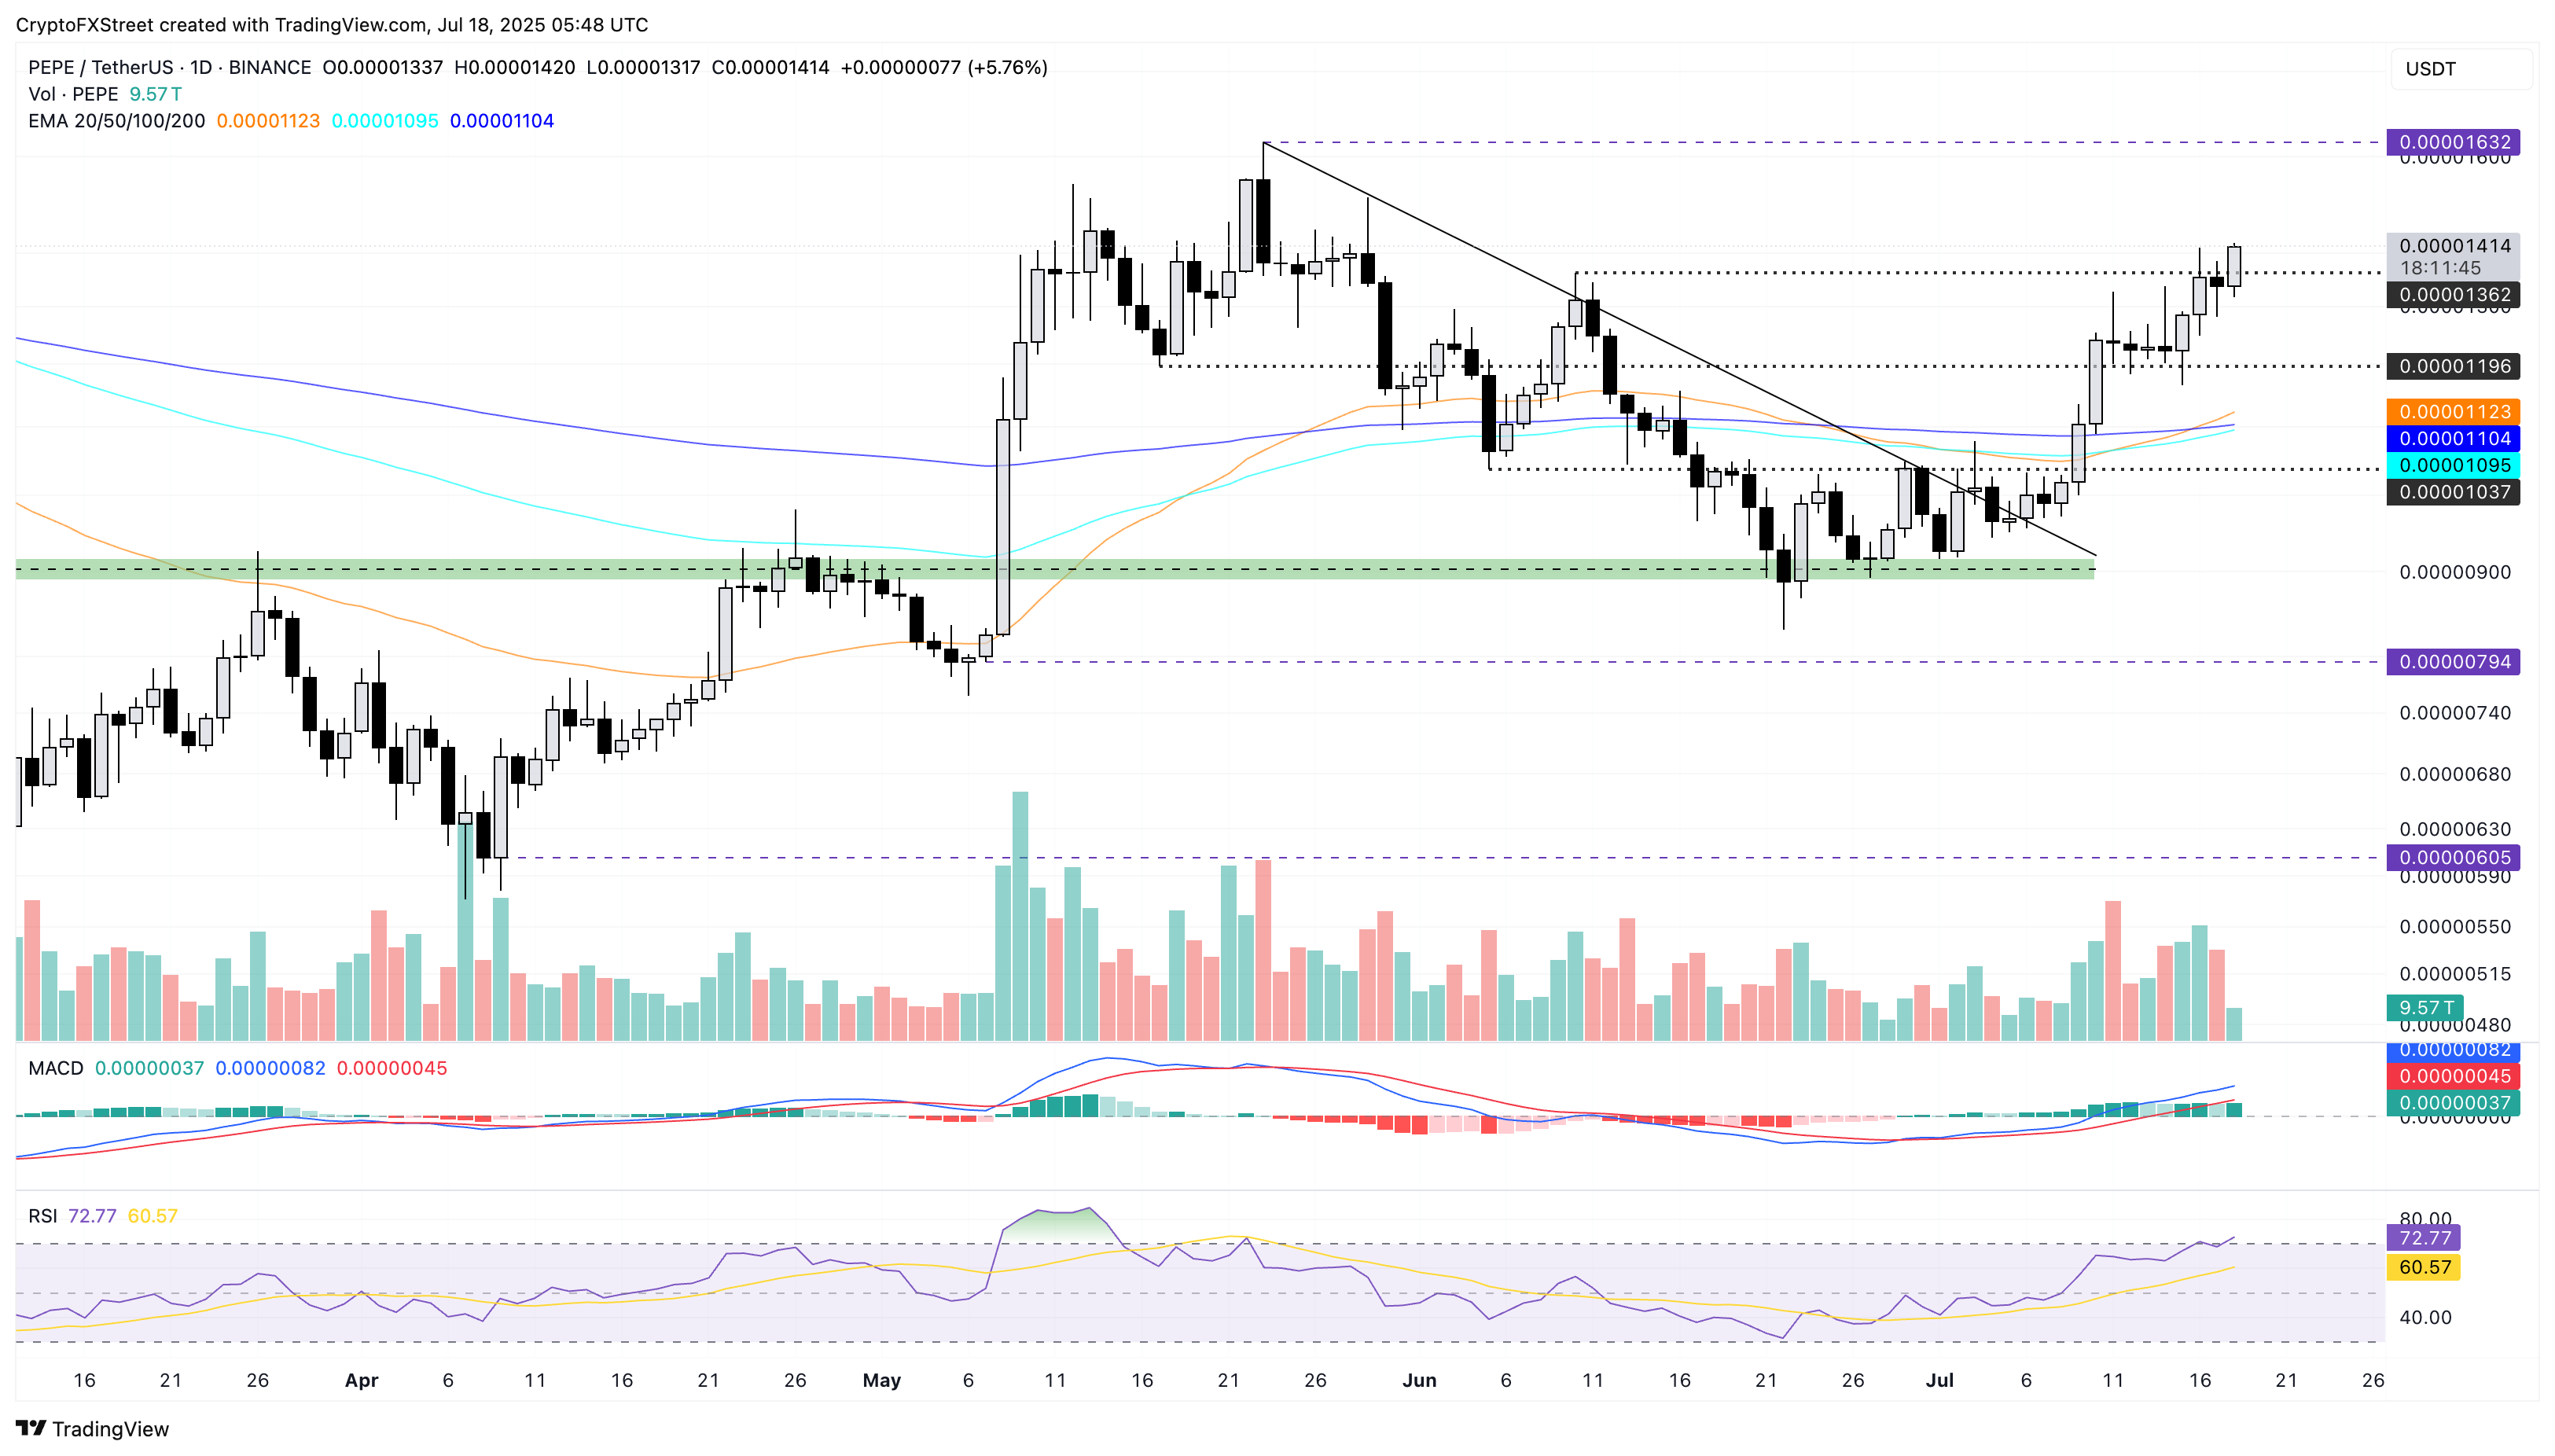
PEPE/USDT daily price chart.
CoinGlass data shows a 6.31% surge in PEPE OI in the last 24 hours, reaching a record all-time high of $787.51 million.
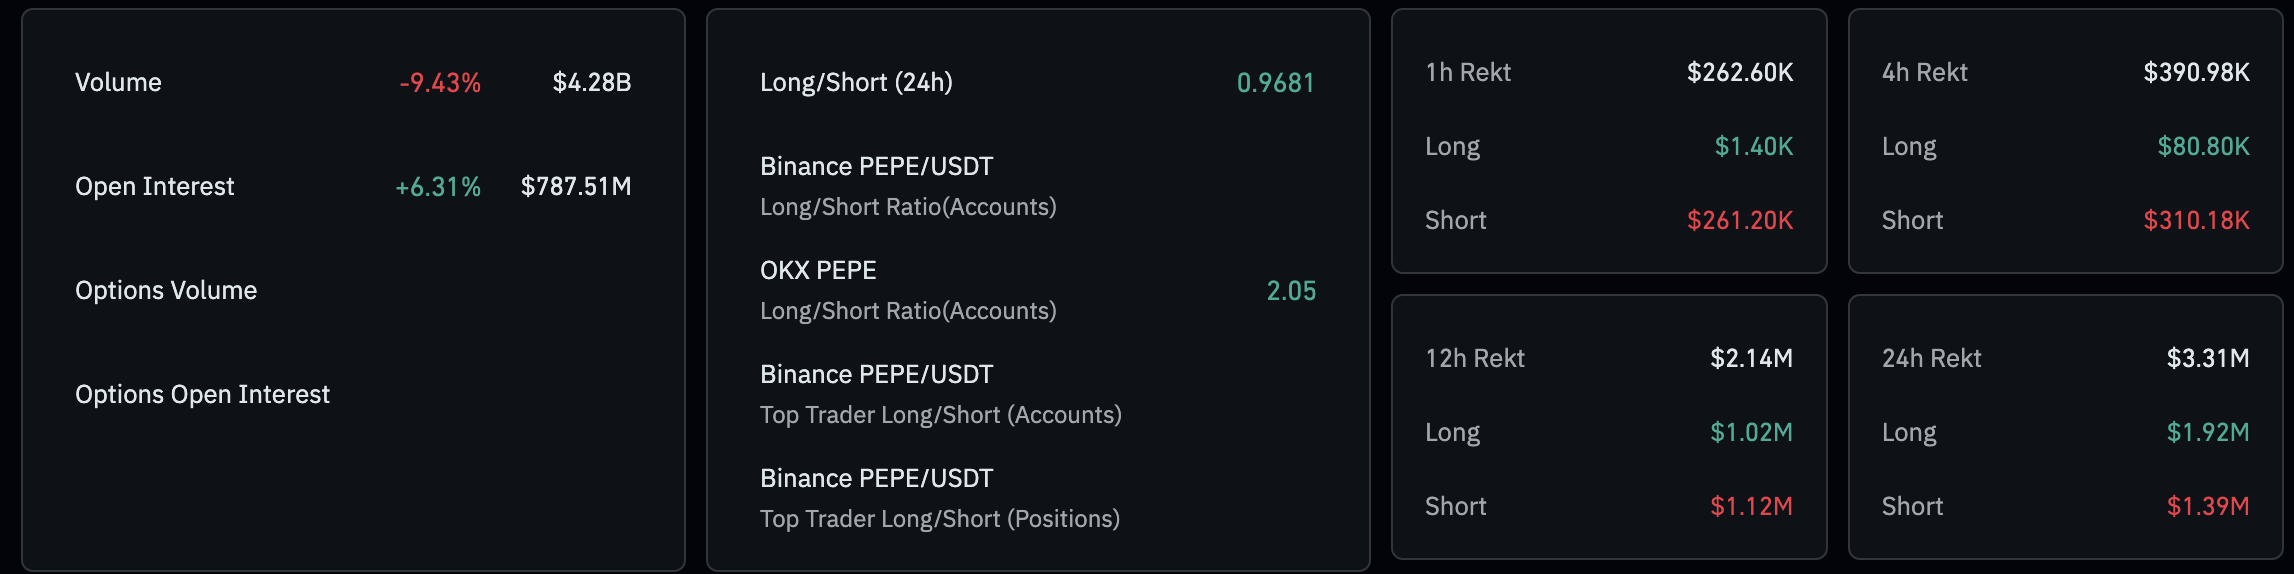
PEPE Open Interest. Source: Coinglass
On the contrary, a flip in PEPE below the $0.00001362 level could extend the decline to the $0.00001196 level, last tested on Tuesday.
Author

Vishal Dixit
FXStreet
Vishal Dixit holds a B.Sc. in Chemistry from Wilson College but found his true calling in the world of crypto.


