Dogecoin price jump above $0.20 triggers $13 million in liquidations
- Dogecoin price reclaims $0.20 after breaking out from an inverse head and shoulders bullish pattern.
- DOGE's rally ignites a string of liquidations, comprising $1.6 million longs and $11.3 million shorts.
- Open Interest surges 18% to $2.17 billion in 24 hours, signaling trader interest in the leading meme coin.
- Dogecoin's near-overbought conditions could delay or hinder a breakout targeting $0.24.

Dogecoin (DOGE) price edges higher after stepping above $0.20 and climbing to trade around $0.21 at the time of writing on Friday. The leading meme coin's uptrend mirrors a broad-based bullish wave in the market, triggered by the trade agreement between the United States (US) and the United Kingdom (UK) on Thursday.
Dogecoin rally sparks massive liquidation wave
Dogecoin's price climbed in an engulfing bullish candle on Thursday, breaking the brief consolidation phase that followed the recovery from the tariff-triggered crash in early April. The meme coin flipped the 50-day Exponential Moving Average (EMA) around $0.18 into support, accelerating the uptrend above $0.20.
Meanwhile, the rally shook up market dynamics, especially for futures and options traders, with liquidations reaching approximately $13 million over the past 24 hours. Short liquidations dominated at $11.3 billion compared to $1.6 million for longs. This heavy skew toward short liquidations signals a short squeeze, where an increase in price forces short sellers to close positions, thus fueling the rally.
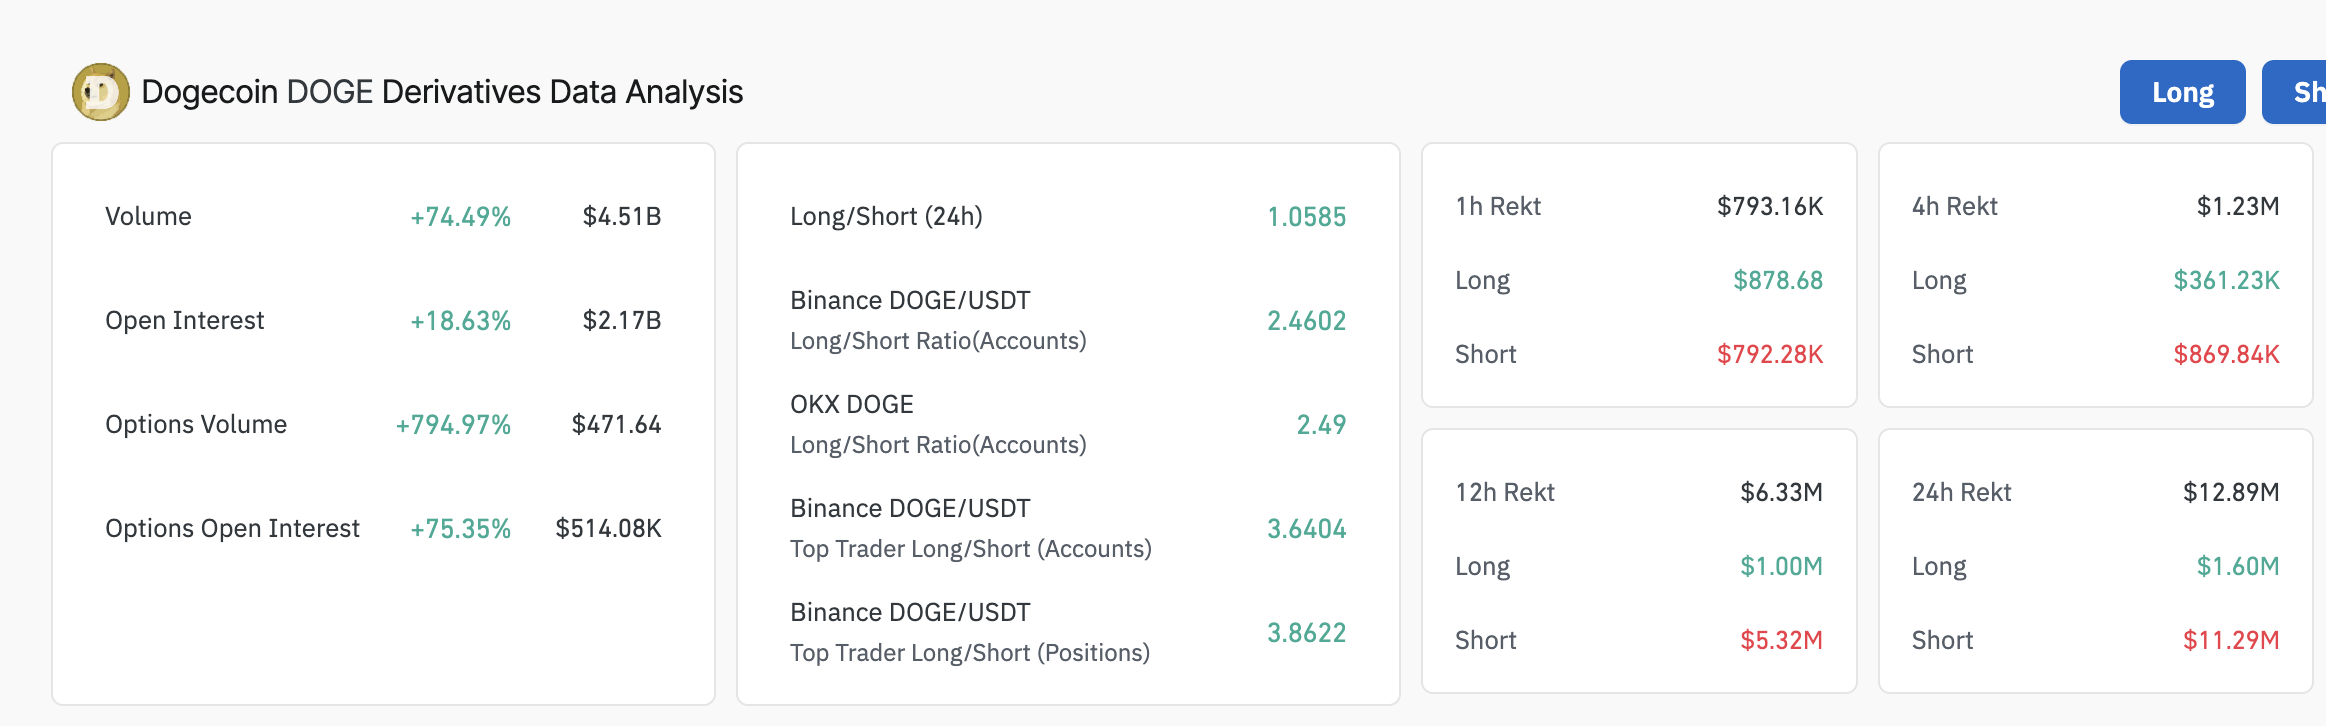
Dogecoin derivatives market data | Source: CoinGlass
The 18% Open Interest (OI) surge to $2.17 billion hints at increasing trader interest in the largest meme coin by market capitalization. In other words, the uptrend in DOGE's price encourages investors to seek exposure, betting on a longer rally.
Additionally, the long-to-short ratio of 2.4602 on Binance shows that long positions primarily drive the OI increase, as traders allocate more capital to bullish bets.
A 74.49% surge in the trading volume to $4.5 billion amplifies the OI and supports the heightened market activity. High volume during an uptrend, like in DOGE, often confirms a strong bullish momentum.
How far can Dogecoin's rally go?
Dogecoin's price displays a strong bullish structure after breaking out and confirming an inverse head and shoulders pattern in the daily chart below. The breakout on Thursday projected an approximately 33% surge to $0.24. The target is determined by measuring the height of the pattern from the neckline to the head and extrapolating above the breakout point.
With DOGE seeking support above the 100-day EMA at $0.20, there's a high probability that the uptrend will continue to tag the inverse head and shoulders patterns' target at $0.24 in upcoming sessions.
The Moving Average Convergence Divergence (MACD) indicator reinforces the bullish structure above the centre line. As the green histograms grow, they indicate a stronger tailwind, pointing to a continued price rise.
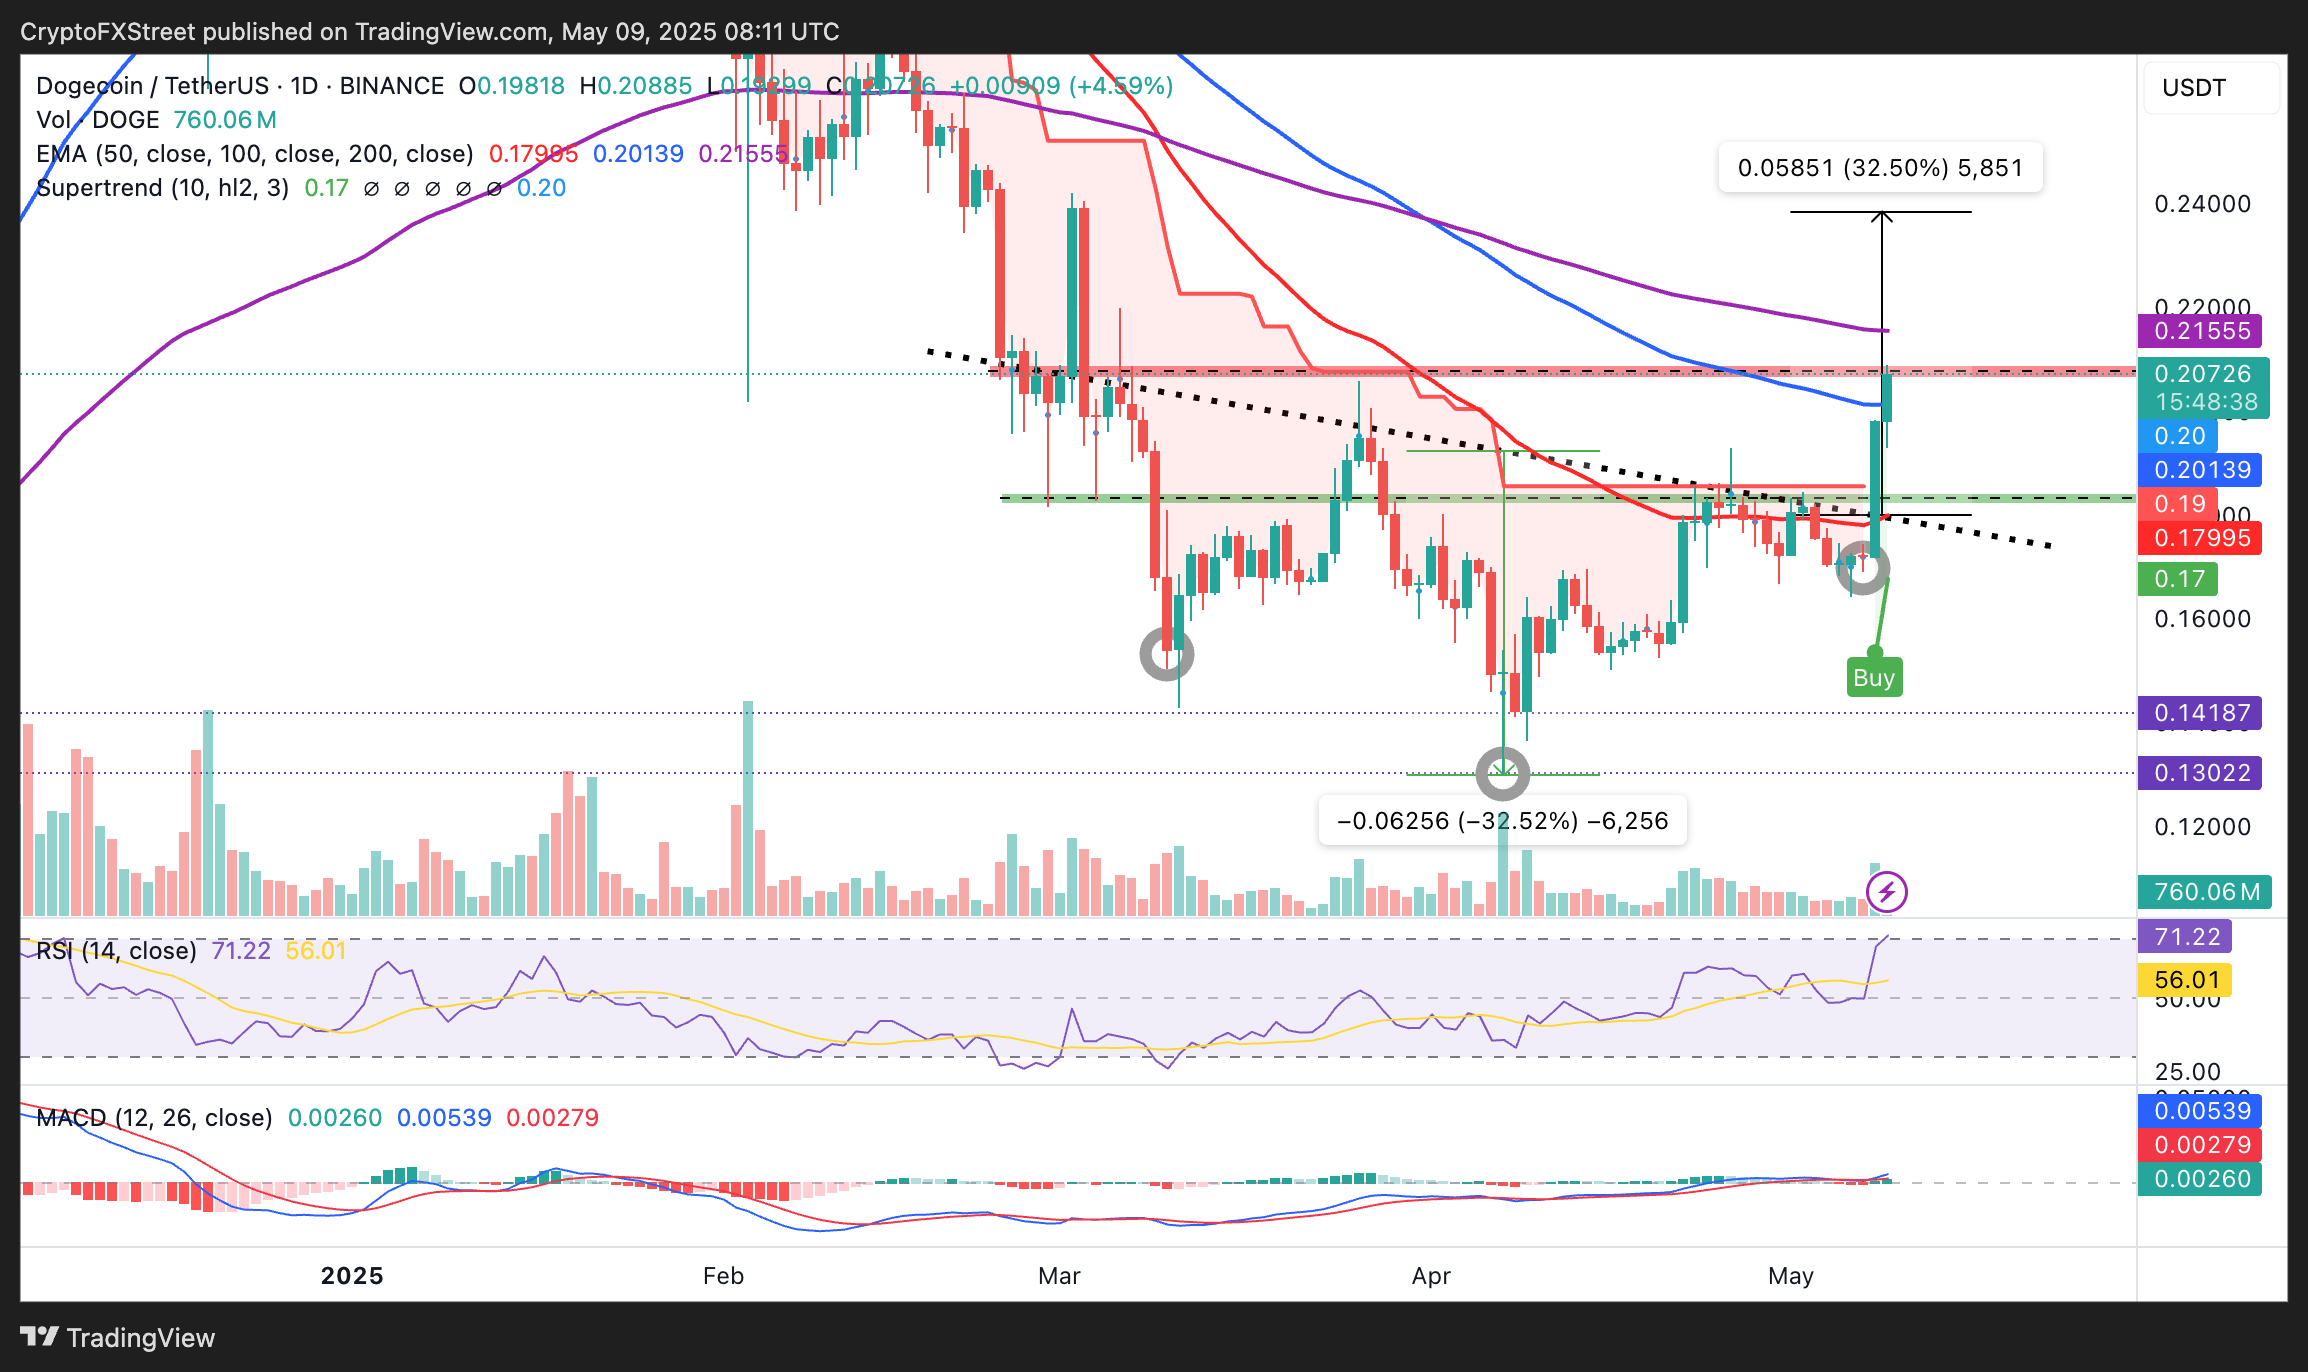
DOGE/USD daily chart
However, traders must prepare for different outcomes as Dogecoin's price rallies, including a potential reversal. The Relative Strength Index (RSI) momentum indicator is entering the overbought region at 70.31, implying a robust uptrend.
Notably, overbought conditions often precede drawdowns due to profit-taking and other market dynamics. If DOGE pulls back beyond the 100-day EMA at $0.20, traders would look to the 50-day EMA at $0.18 for support and liquidity before attempting another breakout higher.
(This story was corrected on May 9 at 10:07 GMT to say that overbought conditions often precede drawdowns due to profit-taking, not oversold conditions.)
Open Interest, funding rate FAQs
Higher Open Interest is associated with higher liquidity and new capital inflow to the market. This is considered the equivalent of increase in efficiency and the ongoing trend continues. When Open Interest decreases, it is considered a sign of liquidation in the market, investors are leaving and the overall demand for an asset is on a decline, fueling a bearish sentiment among investors.
Funding fees bridge the difference between spot prices and prices of futures contracts of an asset by increasing liquidation risks faced by traders. A consistently high and positive funding rate implies there is a bullish sentiment among market participants and there is an expectation of a price hike. A consistently negative funding rate for an asset implies a bearish sentiment, indicating that traders expect the cryptocurrency’s price to fall and a bearish trend reversal is likely to occur.
Author

John Isige
FXStreet
John Isige is a seasoned cryptocurrency journalist and markets analyst committed to delivering high-quality, actionable insights tailored to traders, investors, and crypto enthusiasts. He enjoys deep dives into emerging Web3 tren


