Dogecoin and Shiba Inu show bearish signs
- Dogecoin and Shiba Inu prices hover $0.172 and $0.000012, respectively, on Monday after falling nearly 5% the previous week.
- DOGE and SHIB funding rates are negative, indicating more traders are betting that dog-based meme coins will fall.
- The technical outlook suggests a correction, targeting DOGE $0.157 and SHIB $0.000011.

Dogecoin (DOGE) and Shiba Inu (SHIB) prices hover around $0.172 and $0.000012 at the time of writing on Monday after falling nearly 5% the previous week. DOGE and SHIB funding rates are negative, indicating more traders are betting that dog-based meme coins will fall. Moreover, the technical outlook for both meme coins suggests a correction, targeting DOGE $0.157 and SHIB $0.000011.
Dog-theme meme coins' on-chain metrics show negative biases
According to Coinglass's OI-Weighted Funding Rate data, the number of traders betting that the prices of Dogecoin and Shiba Inu meme coins will slide further is higher than that anticipating a price increase.
This index is based on the yields of futures contracts, which are weighted by their Open Interest (OI) rates. Generally, a positive rate (longs pay shorts) indicates bullish sentiment, while negative numbers (shorts pay longs) indicate bearishness.
In the case of DOGE and SHIB, the metric stands at -0.0012% and -0.0055% respectively, reflecting a negative rate and indicating that shorts are paying longs. This scenario often signifies bearish sentiment in the market, suggesting potential downward pressure on DOGE and SHIB prices.
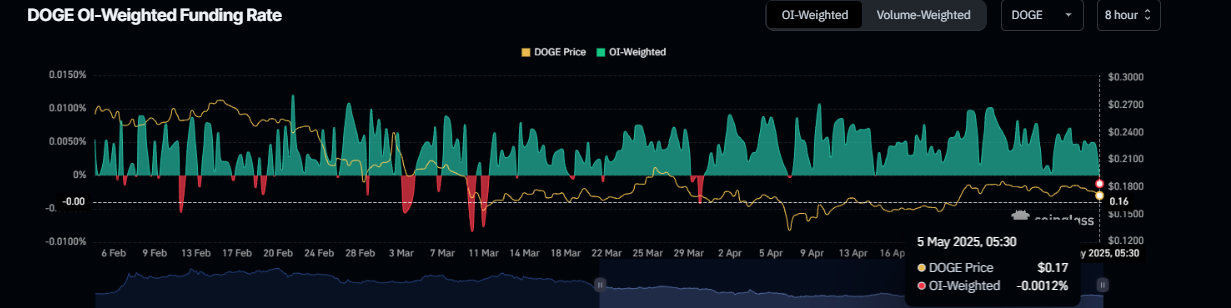
DOGE OI-Weighted Funding Rate chart. Source: Coinglass
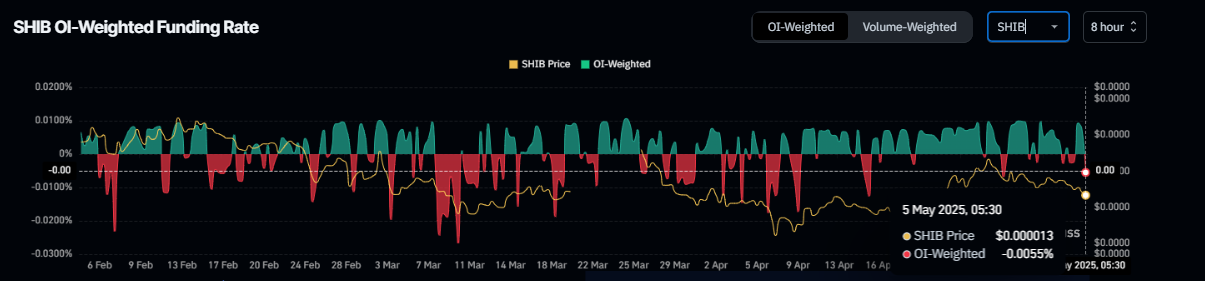
SHIB OI-Weighted Funding Rate chart. Source: Coinglass
Apart from negative funding rates, Dogecoin’s Daily Active Addresses index, which tracks network activity over time, also paints a bearish picture for DOGE. A rise in the metric signals greater blockchain usage, while declining addresses point to lower demand for the network.
In DOGE’s case, Daily Active Addresses have been extending a downtrend starting mid-March and reading 53,000 on Monday. This indicates that demand for DOGE’s blockchain usage is decreasing, which doesn’t bode well for Dogecoin's price.
 [10-1746426356570.33.57, 05 May, 2025].png)
Dogecoin daily active addresses chart. Source: Santiment
Santiment’s Age Consumed index projects a bearish outlook for Shiba Inu. The spikes in this index suggest dormant tokens (tokens stored in wallets for a long time) are in motion, and it can be used to spot short-term local tops or bottoms.
In the case of SHIB, history shows that the spikes were followed by a fall in Shiba Inu’s price as holders moved their tokens from wallets to exchanges, thereby increasing the selling pressure. The most recent uptick on Monday, the highest spike since the end of March, also forecasted that SHIB is ready for a downtrend.
 [10-1746426386830.44.06, 05 May, 2025].png)
SHIB Age Consumed chart. Source: Santiment
Dogecoin Price Forecast: DOGE shows indecisiveness on momentum indicators
Dogecoin price has been facing resistance around the weekly level of $0.181 since April 25 and declined nearly 5% last week. This level roughly coincides with the 50-day Exponential Moving Average (EMA) at $0.178, making it a key resistance zone. At the time of writing on Monday, it hovers at around $0.172.
If the $0.181 level continues to hold as resistance, DOGE could extend the decline to retest its April 22 low of $0.157.
The Relative Strength Index (RSI) on the daily chart hovers around its neutral level of 50, indicating indecisiveness among traders. If the RSI slips below its neutral level of 50, the bearish momentum will strengthen, leading to a fall in the Dogecoin price. Moreover, its Moving Average Convergence Divergence (MACD) is about to flip a bearish crossover. If the MACD shows a bearish crossover, it gives a selling signal and would indicate a downward trend.
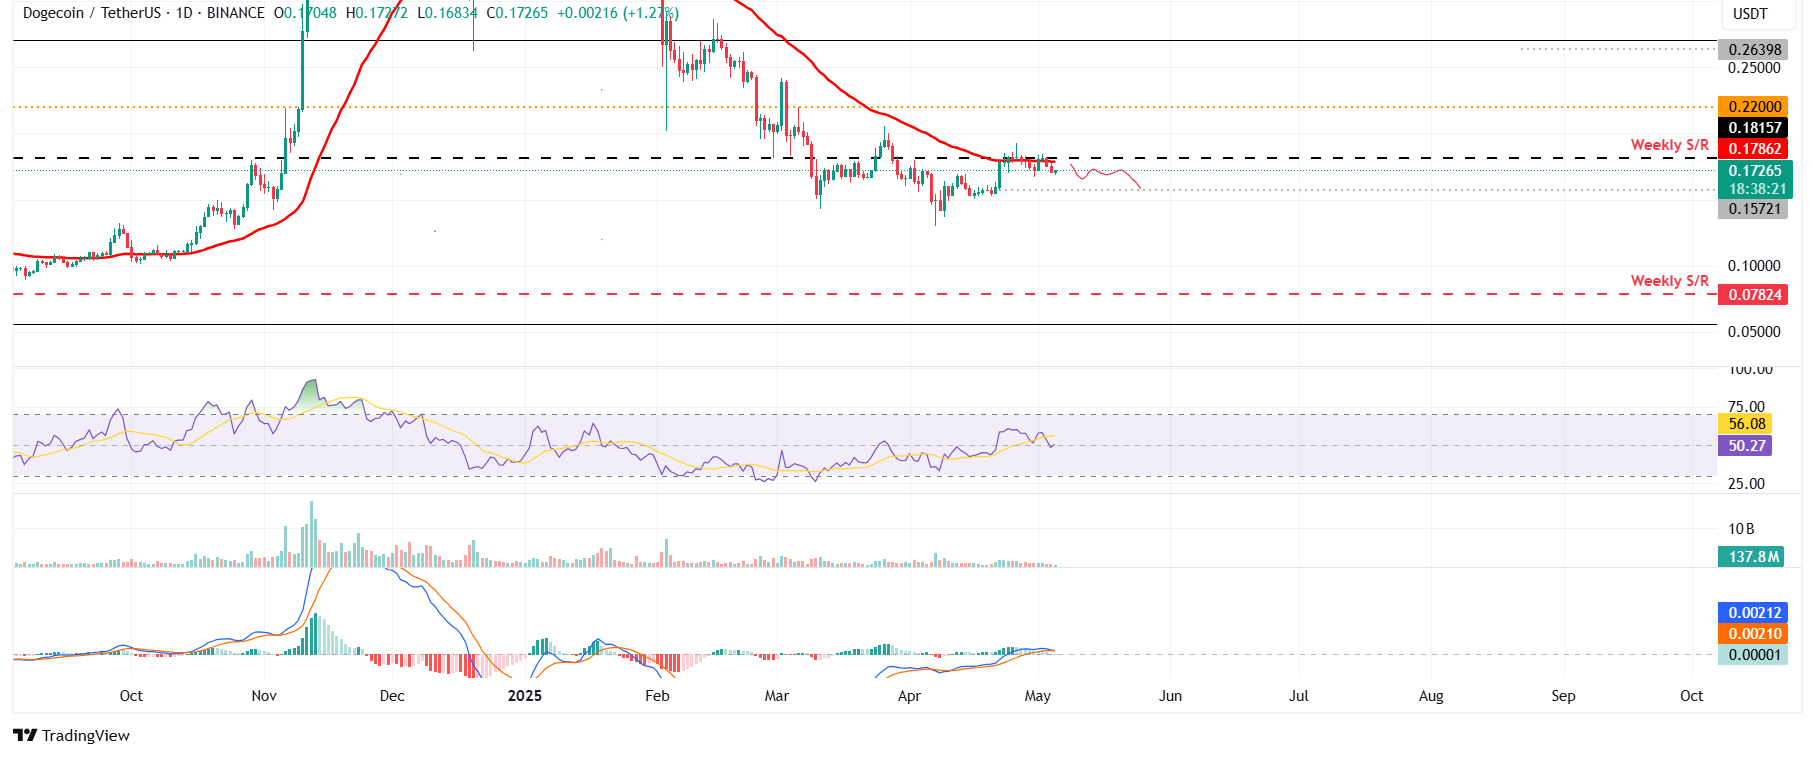
DOGE/USDT daily chart
However, if DOGE breaks and closes above the weekly resistance at $0.181, it would extend the rally to retest its next resistance level at $0.20.
Shiba Inu Price Forecast: SHIB bull shows weakness
Shiba Inu price faced rejection around the descending trendline (drawn by joining multiple highs since mid-December) on April 26 and declined 11% until Sunday. This trendline roughly coincides with the 100-day EMA at $0.000014, making it a key resistance zone. At the time of writing on Monday, it hovers at around $0.000012.
If SHIB continues its pullback, it could extend the correction to retest its April 16 low of $0.000011.
The RSI on the daily chart reads 48, below its neutral level of 50, indicating bearish momentum. Moreover, the MACD indicator also showed a bearish crossover on Sunday, giving a sell signal and suggesting a downward trend ahead.
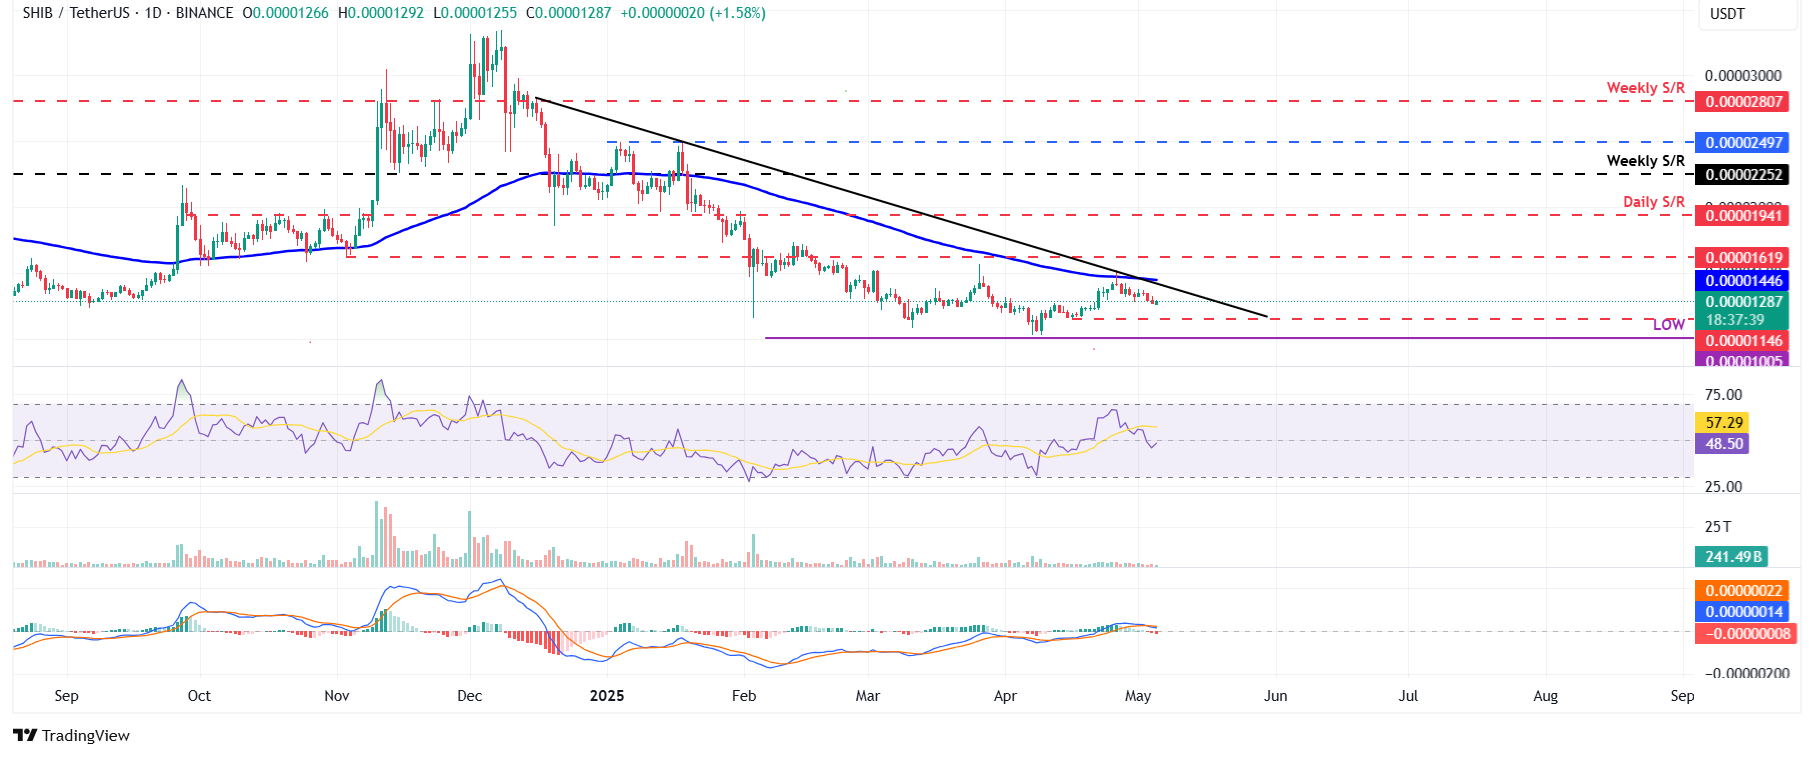
SHIB/USDT daily chart
Conversely, if SHIB breaks and closes above its descending trendline, it could extend its gains toward its next daily resistance at $0.000016
Author

Manish Chhetri
FXStreet
Manish Chhetri is a crypto specialist with over four years of experience in the cryptocurrency industry.


