Did Bitcoin top out at $1,08,367? Critical levels to watch

1. Current pattern unfolding
-
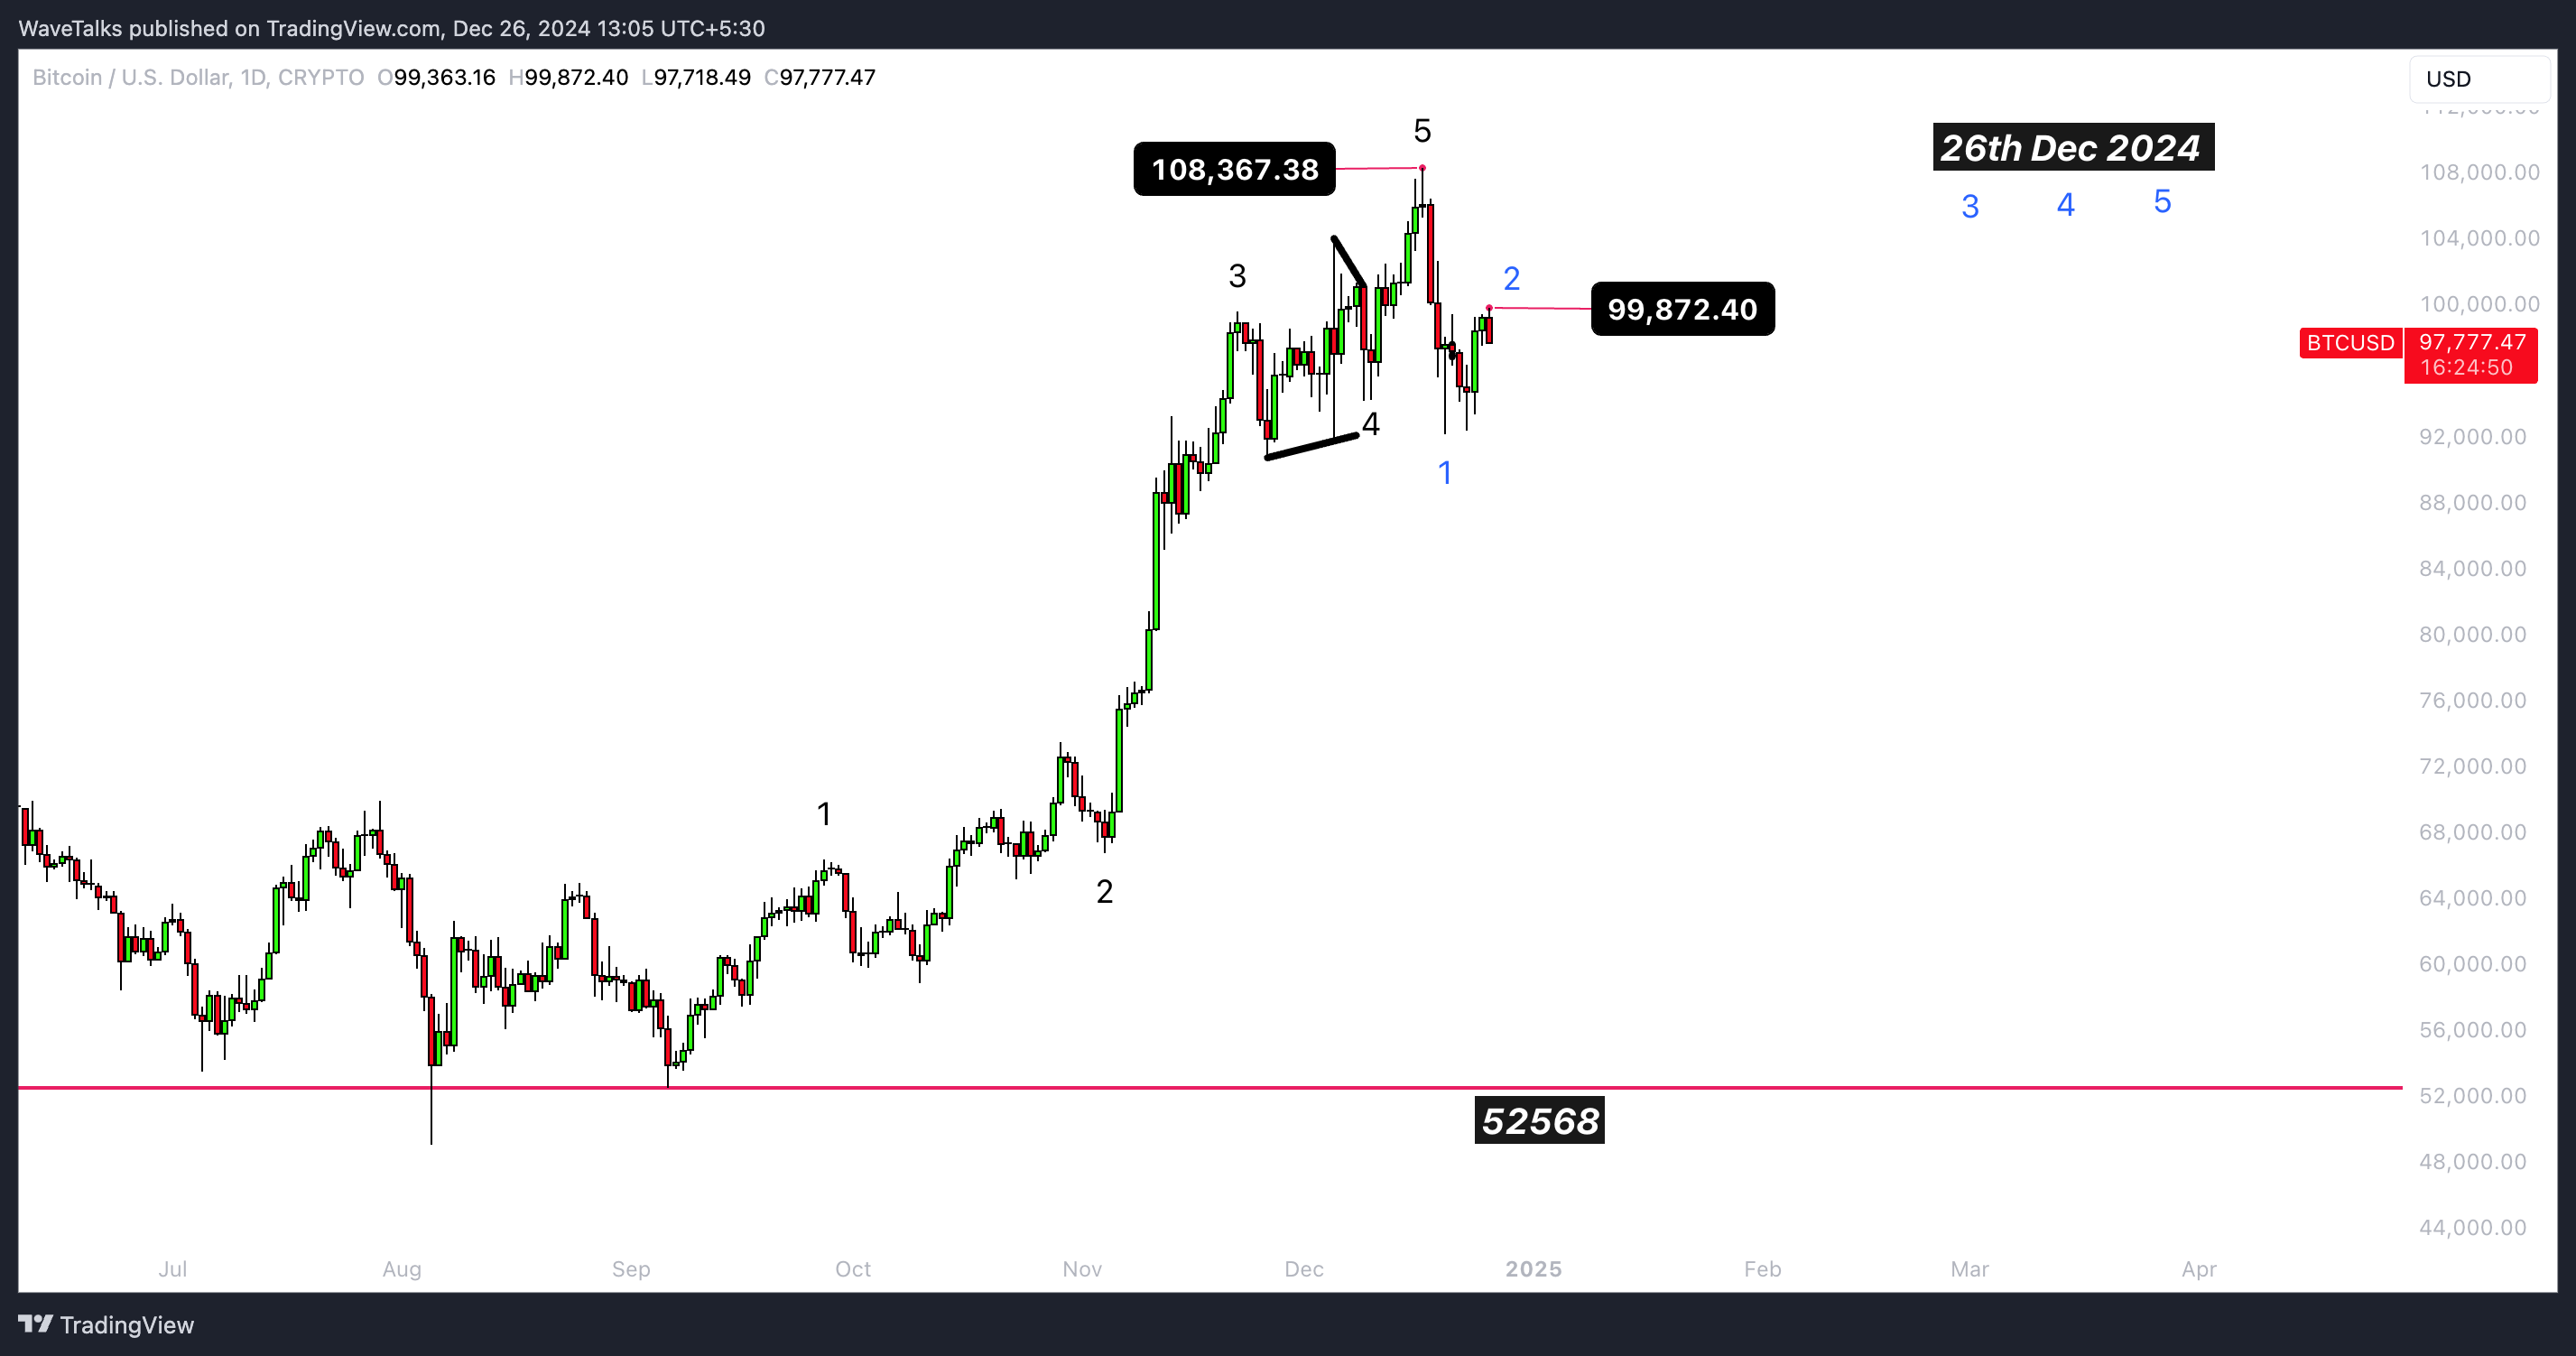
Five-wave rally: The impulsive rally starting from $52,568 appears to have topped out at $1,08,367.
-
V-shape reversal: Bitcoin retraced sharply to $92,209 on 20th Dec 2024.
-
Sideways movement: Over the past 6-7 days, Bitcoin has been in a consolidation phase between $92,209 (lows) and $99,872 (highs), forming a Flat Correction (ABC Wave).
Daily chart - Bitcoin
Key observations
-
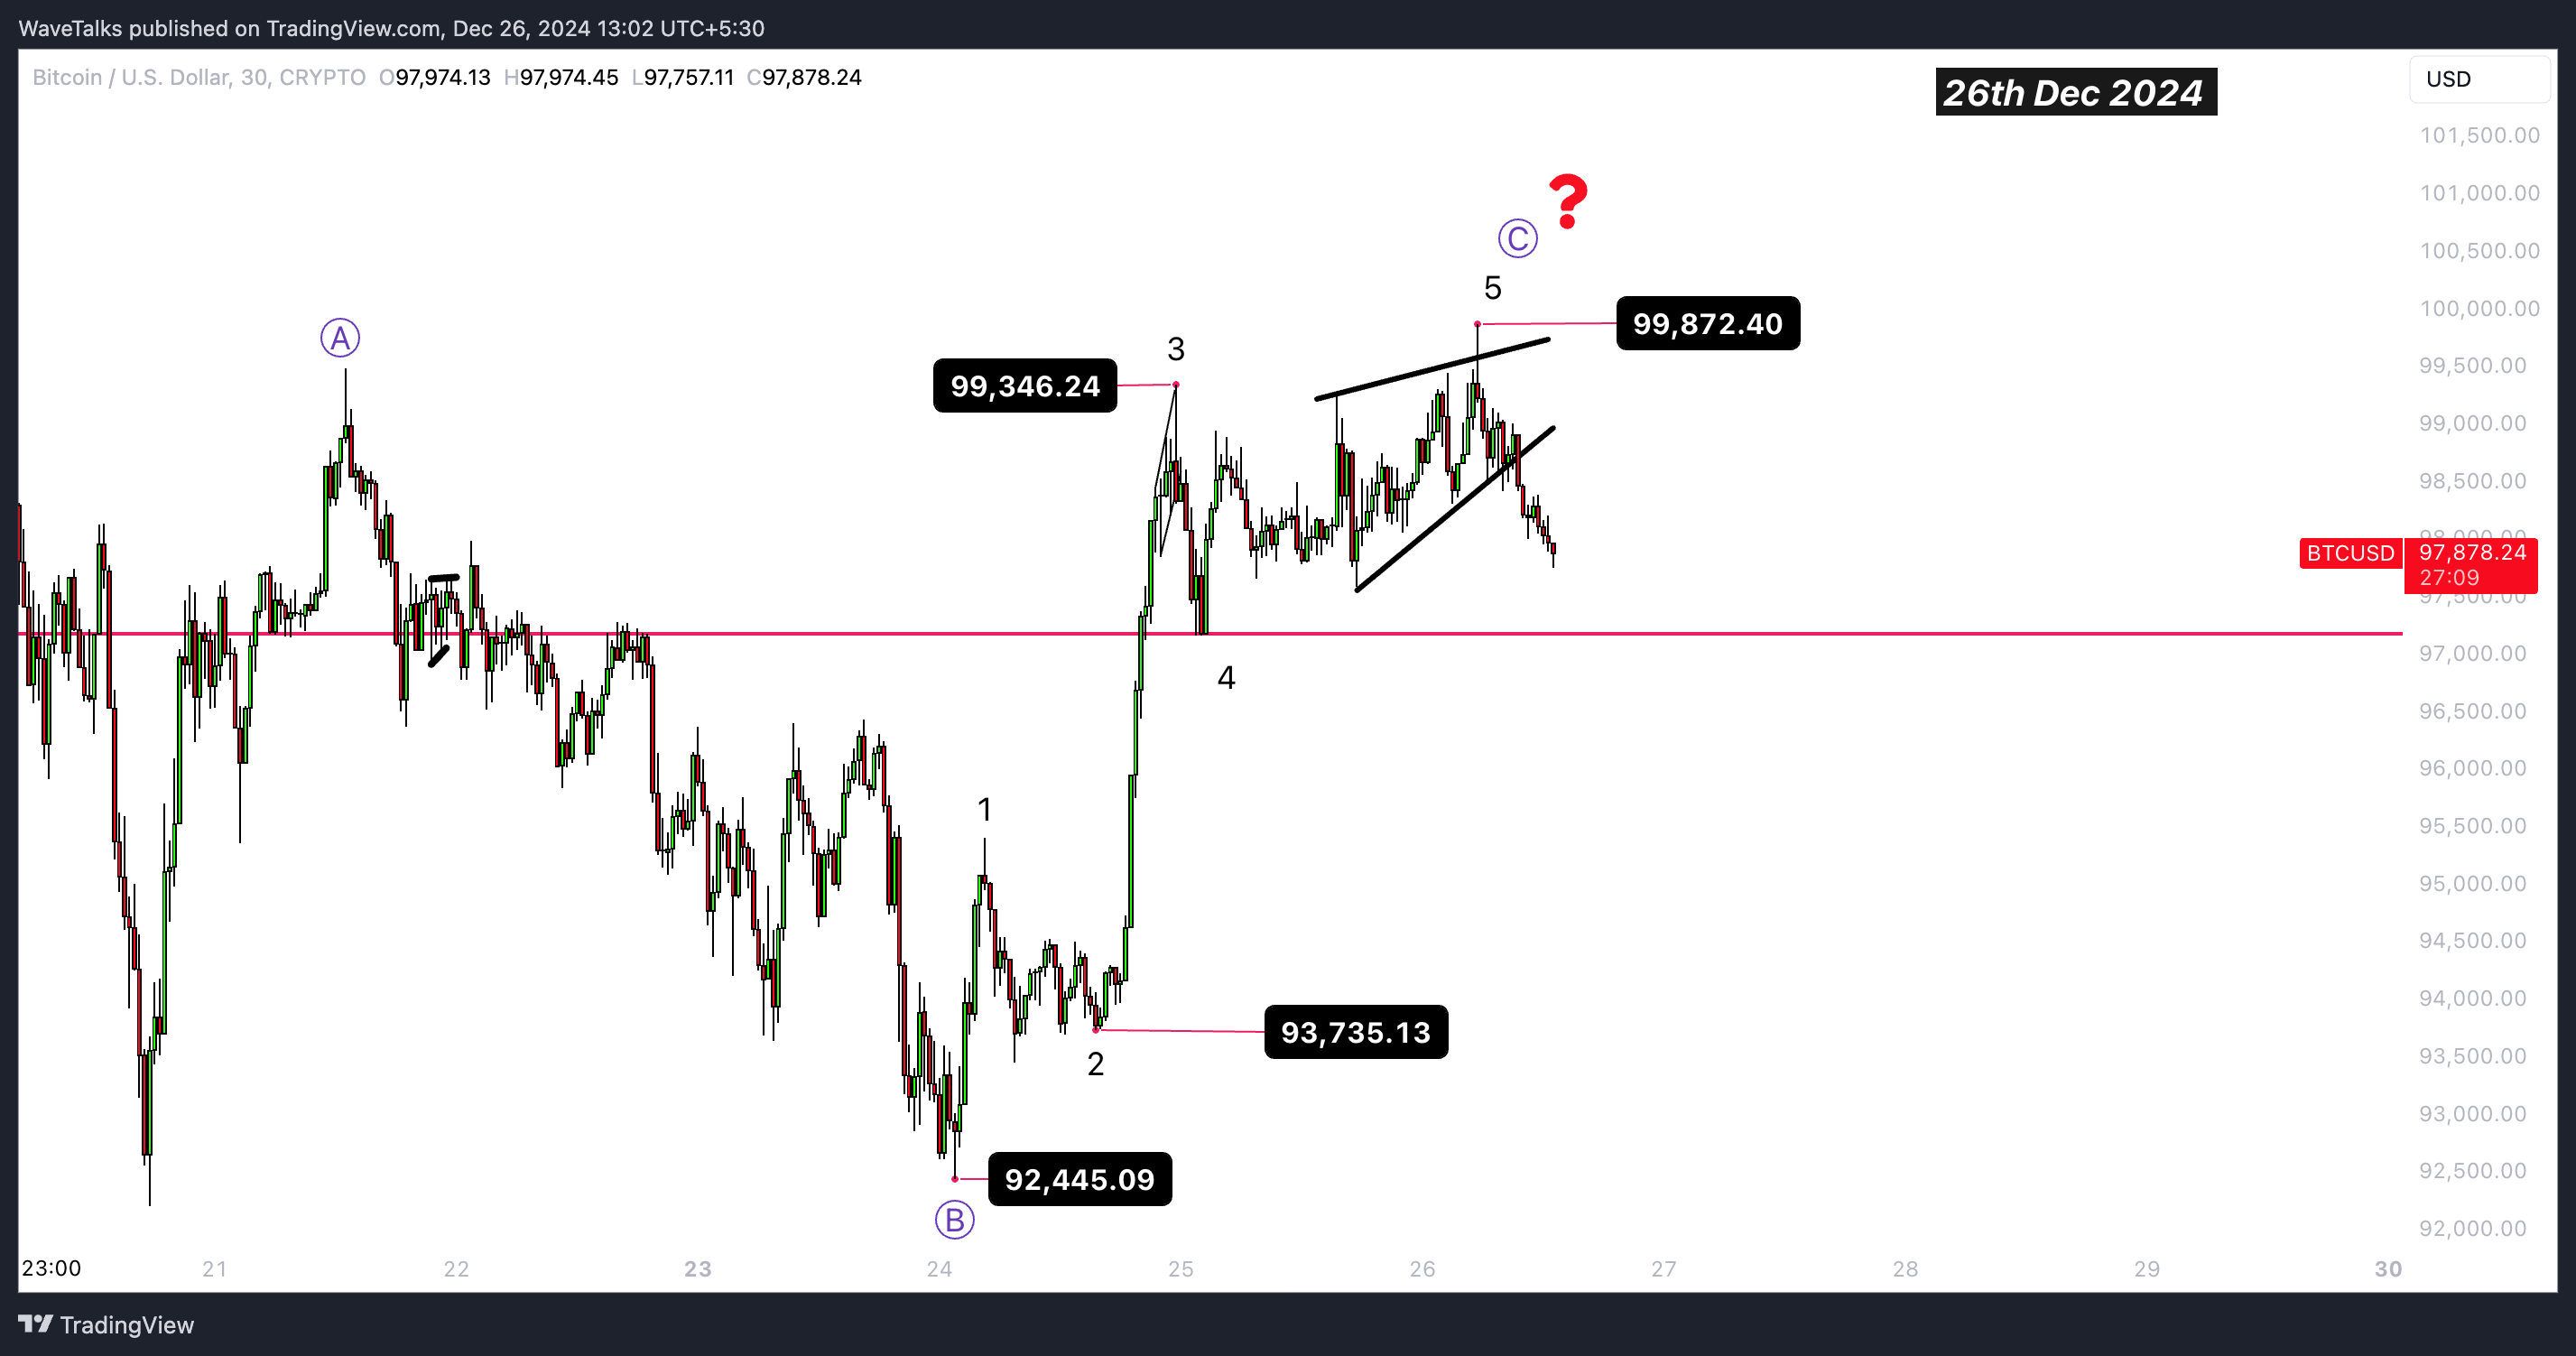
Wave-C: Appears to be an impulsive sequence internally, ending with a Rising Wedge near $99,872.
-
Critical support: $92,209 – the low from 20th Dec 2024.
30 mins chart - Impulsive wave C of flat correction
2. Catching the tops with wave patterns ( 30 mins chart)
- The rising wedge or ending diagonal at $99,872 highs is one of the most rewarding patterns in Elliott Wave analysis.
-
Understanding and applying this pattern effectively allows you to catch tops and prepare for reversals.
-
Key takeaway: If you're on the right side of the pattern—as I was recently—you can reap significant rewards from such setups.
3. Possible strategies
Scenario 1: Fall below $92,209
-
If Bitcoin breaks below $92,209, it could confirm a larger corrective phase.
-
Key downside targets:
-
$83,625: Equality projection of the fall from $1,08,367 to $92,209.
-
$73,555: 162% extension projection of the same move.
-
-
Strategy:
-
Wait for confirmation below $92,209 before entering short positions.
-
Use $92,209 as the invalidation level for bullish positions.
-
Scenario 2: Holding above $92,209
-
Bitcoin may continue its consolidation, eventually breaking higher.
-
Strategy:
-
Monitor for a breakout above $99,872 to confirm a resumption of the uptrend.
-
Target higher levels for Wave-2 correction, with stops below $92,209.
-
4. Outlook for next week (by 3rd Jan 2025)
-
The sideways movement is expected to resolve, providing clear directional cues.
-
Bearish bias: Favored if $92,209 breaks decisively.
-
Bullish potential: A strong hold above $92,209 with a breakout above $99,872 could invalidate the bearish outlook and has to be reviewed again later.
Author

Abhishek H. Singh
WaveTalks
Abhishek is a seasoned financial analyst with over a decade of experience specializing in Elliott Wave Theory.



